Plot Positional Physicochemical Property Analysis
Source:R/positionalProperty.R
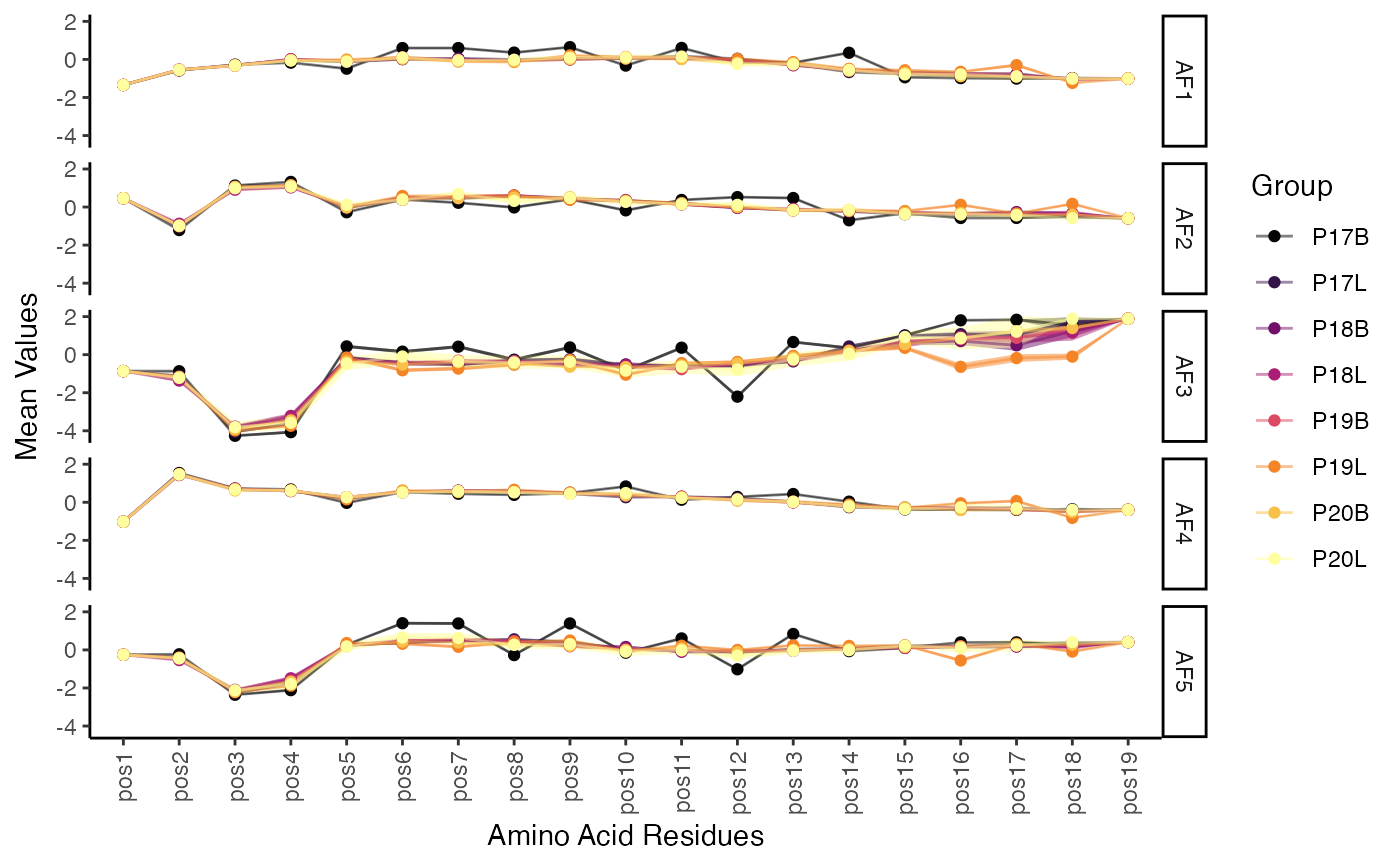
positionalProperty.RdThis function analyzes the physicochemical properties of amino acids at each position along the CDR3 sequence. It calculates the mean property value and the 95% confidence interval for each position across one or more groups, visualizing the results as a line plot with a confidence ribbon.
Usage
positionalProperty(
  input.data,
  chain = "TRB",
  group.by = NULL,
  order.by = NULL,
  aa.length = 20,
  method = "atchleyFactors",
  export.table = NULL,
  palette = "inferno",
  exportTable = NULL,
  ...
)
Arguments
- input.data
The product of
combineTCR(),combineBCR(), orcombineExpression()- chain
The TCR/BCR chain to use. Use
bothto include both chains (e.g., TRA/TRB). Accepted values:TRA,TRB,TRG,TRD,IGH,IGL,IGK,Light(for both light chains), orboth(for TRA/B and Heavy/Light).- group.by
A column header in the metadata or lists to group the analysis by (e.g., "sample", "treatment"). If
NULL, data will be analyzed by list element or active identity in the case of single-cell objects.- order.by
A character vector defining the desired order of elements of the
group.byvariable. Alternatively, usealphanumericto sort groups automatically.- aa.length
The maximum length of the CDR3 amino acid sequence.
- method
Character string (one of the supported names) Defaults to
"atchleyFactors", but includes:"crucianiProperties","FASGAI","kideraFactors","MSWHIM","ProtFP","stScales","tScales","VHSE","zScales"- export.table
If
TRUE, returns a data frame or matrix of the results instead of a plot.- palette
Colors to use in visualization - input any hcl.pals
- exportTable
![[Deprecated]](figures/lifecycle-deprecated.svg) Use
Use export.tableinstead.- ...
Additional arguments passed to the ggplot theme
Value
A ggplot object displaying property by amino acid position.
If exportTable = TRUE, a matrix of the raw data is returned.
Details
The function uses one of several established physicochemical property scales to convert amino acid sequences into numerical vectors. More information for the individual methods can be found at the following citations:
atchleyFactors: citation
crucianiProperties: citation
FASGAI: citation
kideraFactors: citation
MSWHIM: citation
ProtFP: citation
stScales: citation
tScales: citation
VHSE: citation
zScales: citation
Examples
# Making combined contig data
combined <- combineTCR(contig_list,
                        samples = c("P17B", "P17L", "P18B", "P18L",
                                    "P19B","P19L", "P20B", "P20L"))

# Using positionalProperty()
positionalProperty(combined,
                   chain = "TRB",
                   method = "atchleyFactors",
                   aa.length = 20)