This function quantifies and visualizes the usage of V, D, or J genes, or gene pairings across T or B cell clones.
Usage
percentGeneUsage(
  input.data,
  chain = "TRB",
  genes = "TRBV",
  group.by = NULL,
  order.by = NULL,
  summary.fun = c("percent", "proportion", "count"),
  plot.type = "heatmap",
  export.table = NULL,
  palette = "inferno",
  exportTable = NULL,
  ...
)

vizGenes(
  input.data,
  x.axis = "TRBV",
  y.axis = NULL,
  group.by = NULL,
  plot = "heatmap",
  order.by = NULL,
  summary.fun = c("percent", "proportion", "count"),
  export.table = NULL,
  palette = "inferno",
  exportTable = NULL
)

percentGenes(
  input.data,
  chain = "TRB",
  gene = "Vgene",
  group.by = NULL,
  order.by = NULL,
  export.table = NULL,
  summary.fun = c("percent", "proportion", "count"),
  palette = "inferno",
  exportTable = NULL
)

percentVJ(
  input.data,
  chain = "TRB",
  group.by = NULL,
  order.by = NULL,
  summary.fun = c("percent", "proportion", "count"),
  export.table = NULL,
  palette = "inferno",
  exportTable = NULL
)
Arguments
- input.data
The product of
combineTCR(),combineBCR(), orcombineExpression().- chain
The TCR/BCR chain to use. Accepted values:
TRA,TRB,TRG,TRD,IGH,IGL(for both light chains)- genes
A character vector specifying the gene loci to analyze. Can be a single gene e.g., "TRBV" or "IGHJ" or a pair for genes analysis (e.g., c("TRBV", "TRAV"), or "TRBV", "TRBJ").
- group.by
A column header in the metadata or lists to group the analysis by (e.g., "sample", "treatment"). If
NULL, data will be analyzed as by list element or active identity in the case of single-cell objects.- order.by
A character vector defining the desired order of elements of the
group.byvariable. Alternatively, usealphanumericto sort groups automatically.- summary.fun
Character string choosing the summary statistic -
"percent"(default),"proportion", or"count".- plot.type
The type of plot to return:
"heatmap"(default for paired loci, also available for single loci), or"barplot"(for single loci).- export.table
If
TRUE, returns a data frame or matrix of the results instead of a plot.- palette
Colors to use in visualization - input any
- exportTable
![[Deprecated]](figures/lifecycle-deprecated.svg) Use
Use export.tableinstead. hcl.pals.- ...
Additional arguments passed to the ggplot theme
- x.axis
Gene segments to separate the x-axis, such as
TRAV,TRBD,IGKJ.- y.axis
Variable to separate the y-axis, can be both categorical or other gene gene segments, such as
TRAV,TRBD,IGKJ.- plot
The type of plot to return - heatmap or barplot.
- gene
Vgene,DgeneorJgene
Value
A ggplot object displaying a heatmap or bar plot of gene usage.
If exportTable = TRUE, a matrix or data frame of the raw data is returned.
Examples
# Making combined contig data
combined <- combineTCR(contig_list,
samples = c("P17B", "P17L", "P18B", "P18L",
"P19B","P19L", "P20B", "P20L"))
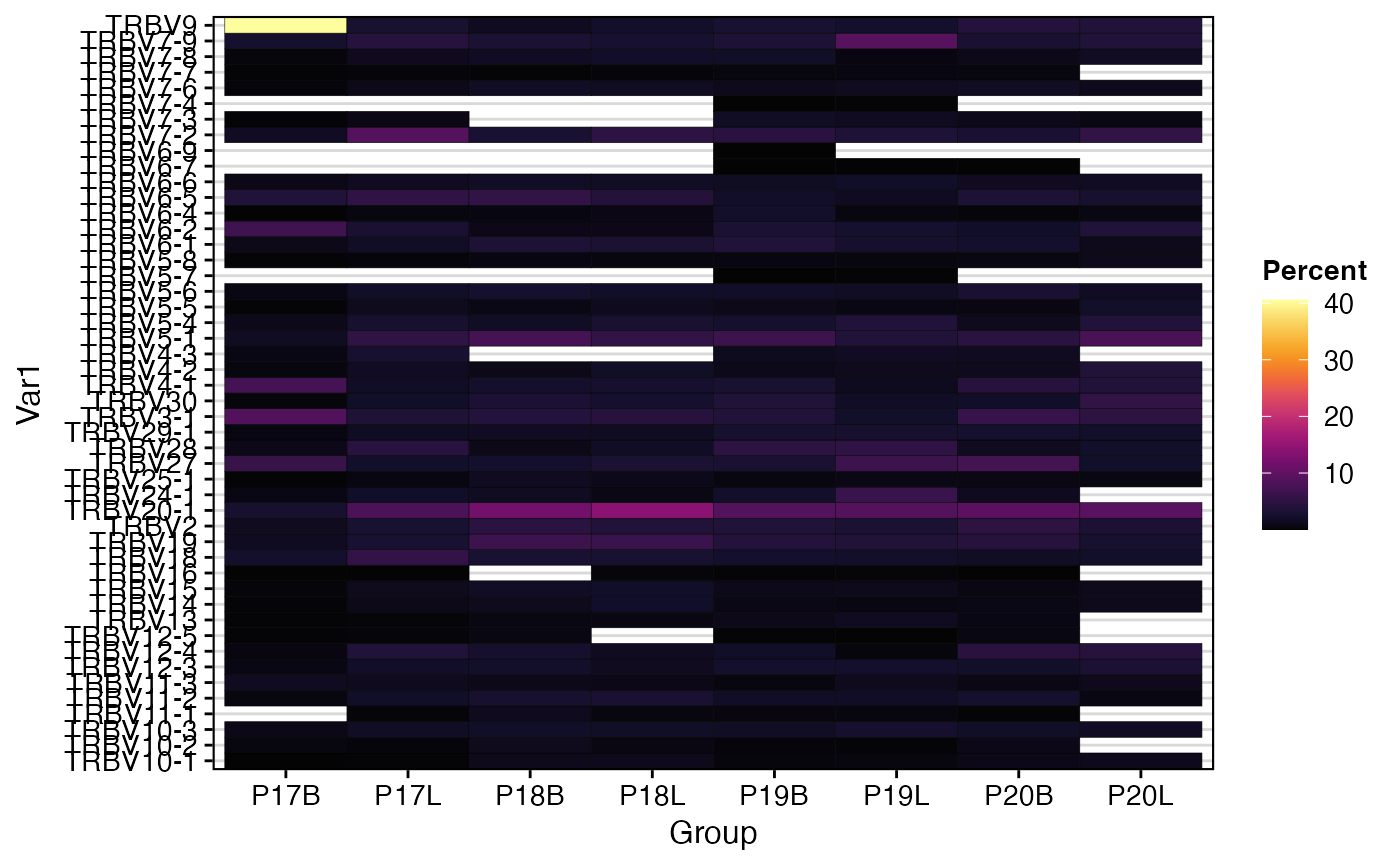
# Visualize single gene (TRBV) usage as a heatmap, grouped by sample
percentGeneUsage(combined,
genes = "TRBV",
group.by = "sample",
plot.type = "heatmap",
summary.fun = "percent")
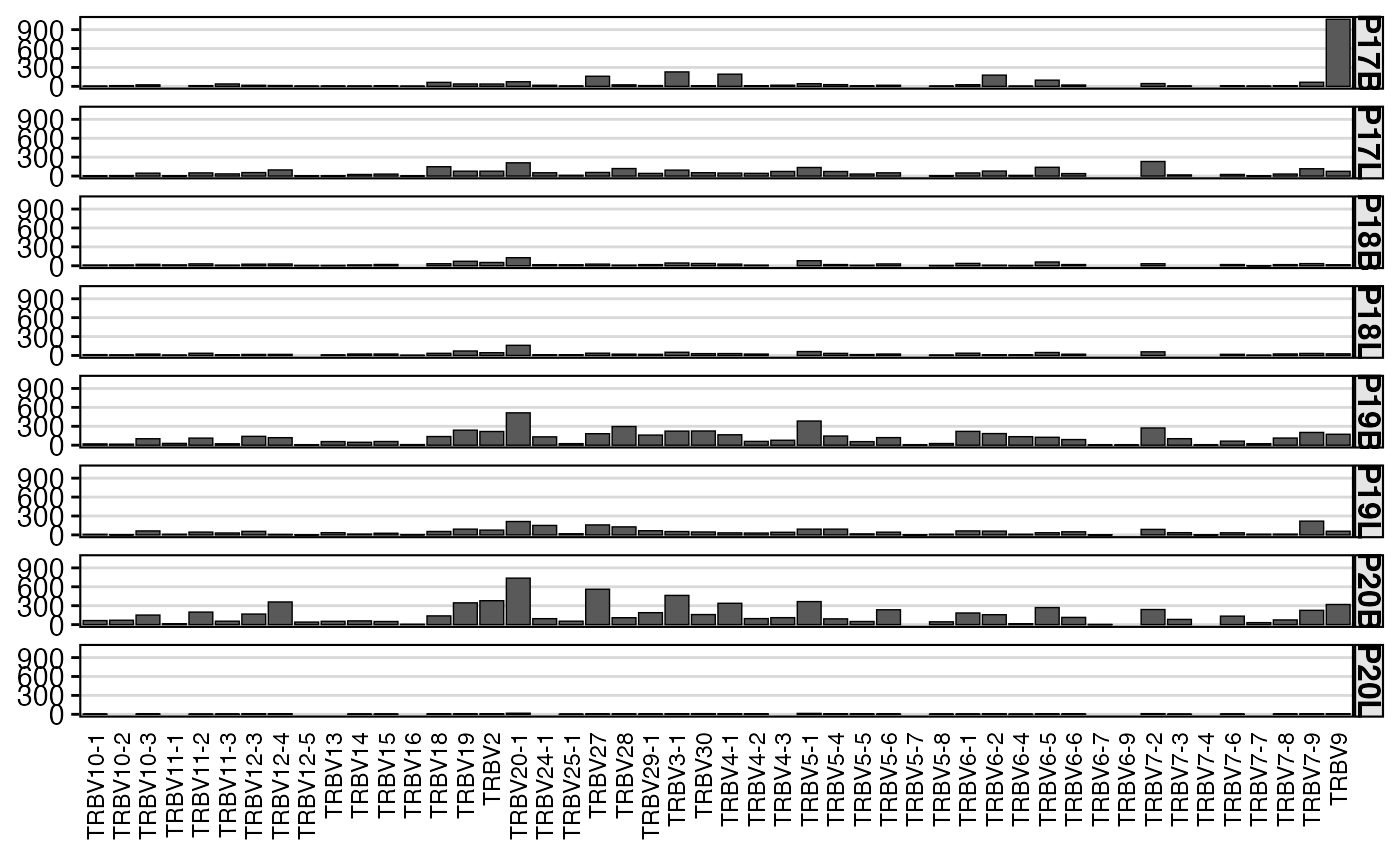
 # Visualize single gene (TRBV) usage as a barplot, grouped by sample
percentGeneUsage(combined,
genes = "TRBV",
group.by = "sample",
plot.type = "barplot",
summary.fun = "count")
# Visualize single gene (TRBV) usage as a barplot, grouped by sample
percentGeneUsage(combined,
genes = "TRBV",
group.by = "sample",
plot.type = "barplot",
summary.fun = "count")
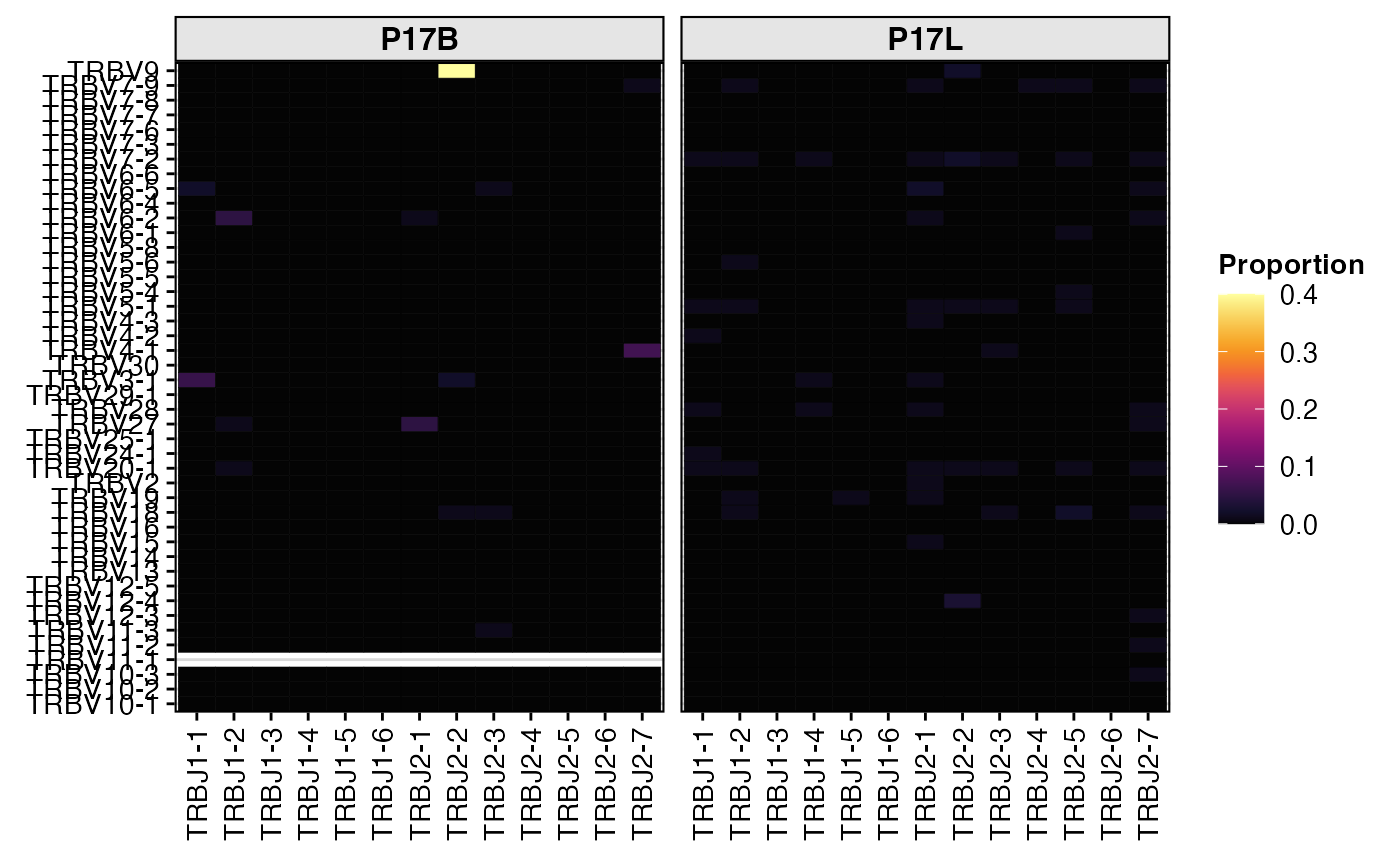
 # Visualize paired gene (TRBV-TRBJ) usage as a heatmap
percentGeneUsage(combined[1:2],
genes = c("TRBV", "TRBJ"),
group.by = "sample",
plot.type = "heatmap",
summary.fun = "proportion")
# Visualize paired gene (TRBV-TRBJ) usage as a heatmap
percentGeneUsage(combined[1:2],
genes = c("TRBV", "TRBJ"),
group.by = "sample",
plot.type = "heatmap",
summary.fun = "proportion")
 # Export the raw data table for single gene usage
trbv_usage_table <- percentGeneUsage(combined,
genes = "TRBV",
group.by = "sample",
export.table = TRUE,
summary.fun = "count")
# Export the raw data table for paired gene usage
trbv_trbj_usage_table <- percentGeneUsage(combined,
genes = c("TRBV", "TRBJ"),
group.by = "sample",
export.table = TRUE,
summary.fun = "percent")
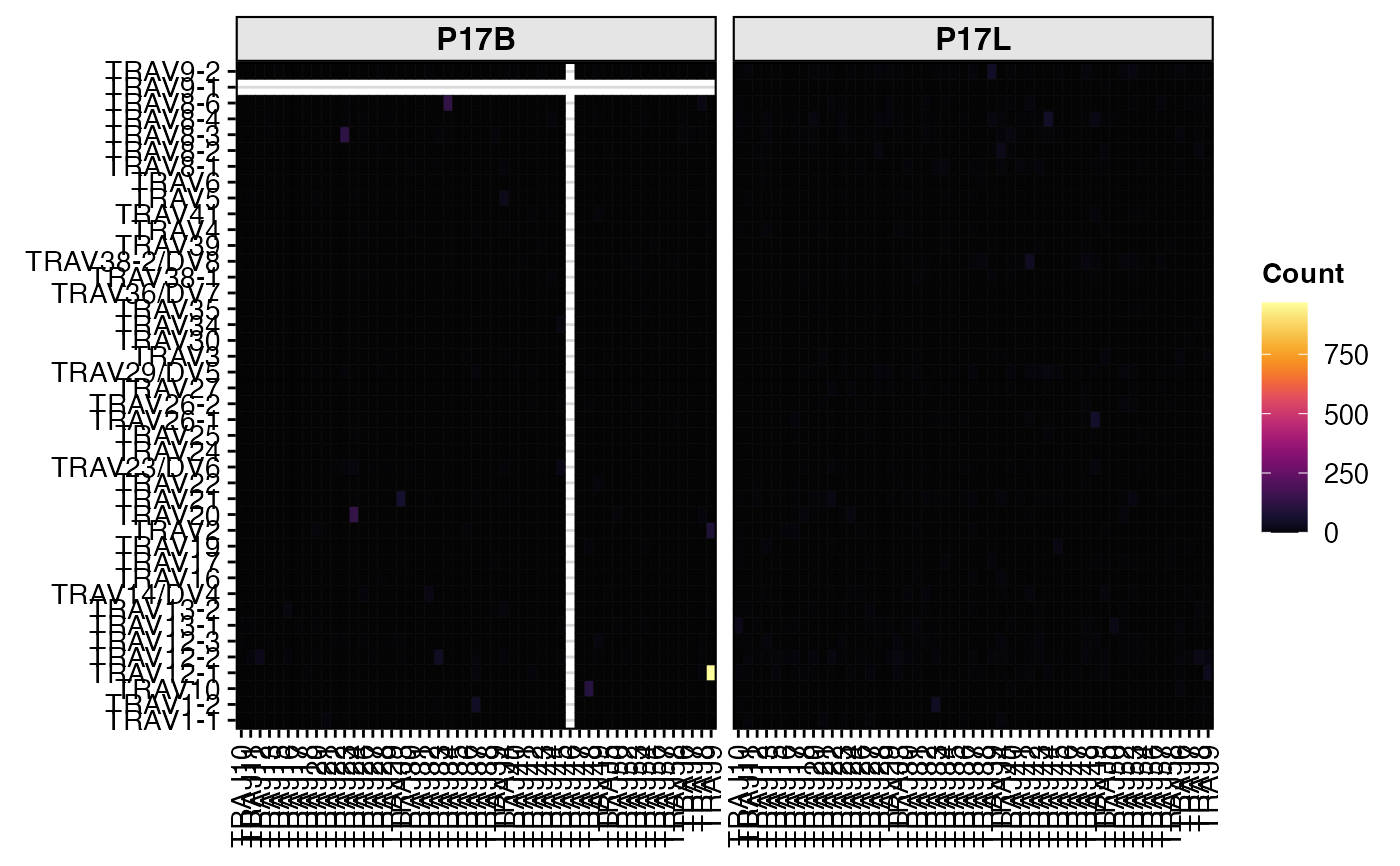
# Visualize paired gene (TRAV-TRAJ) usage as a heatmap
vizGenes(combined[1:2],
x.axis = "TRAV",
y.axis = "TRAJ",
group.by = "sample",
summary.fun = "count")
# Export the raw data table for single gene usage
trbv_usage_table <- percentGeneUsage(combined,
genes = "TRBV",
group.by = "sample",
export.table = TRUE,
summary.fun = "count")
# Export the raw data table for paired gene usage
trbv_trbj_usage_table <- percentGeneUsage(combined,
genes = c("TRBV", "TRBJ"),
group.by = "sample",
export.table = TRUE,
summary.fun = "percent")
# Visualize paired gene (TRAV-TRAJ) usage as a heatmap
vizGenes(combined[1:2],
x.axis = "TRAV",
y.axis = "TRAJ",
group.by = "sample",
summary.fun = "count")
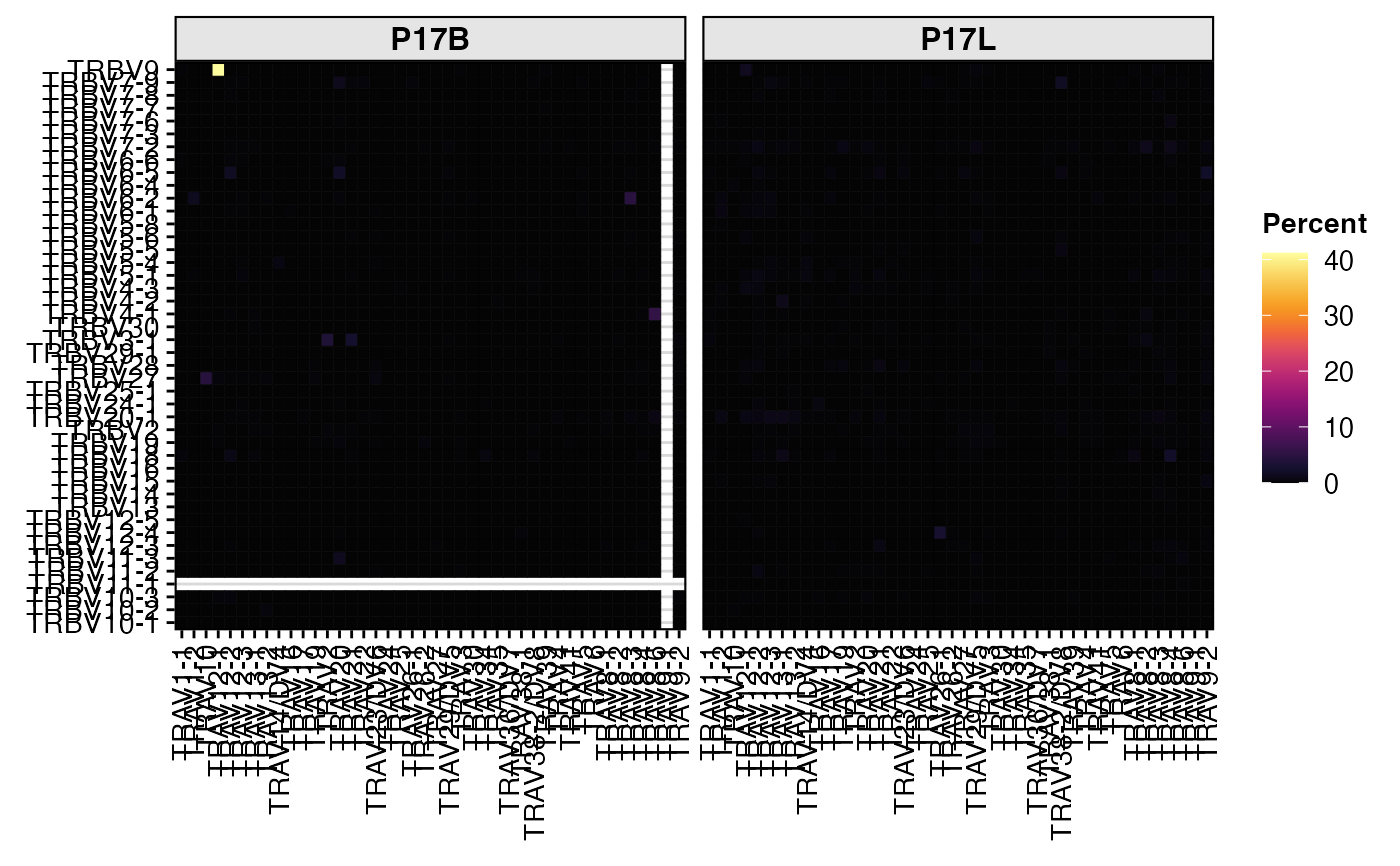
 # Visualize cross-chain gene pairing (TRBV-TRAV)
vizGenes(combined[1:2],
x.axis = "TRBV",
y.axis = "TRAV",
group.by = "sample",
summary.fun = "percent")
# Visualize cross-chain gene pairing (TRBV-TRAV)
vizGenes(combined[1:2],
x.axis = "TRBV",
y.axis = "TRAV",
group.by = "sample",
summary.fun = "percent")
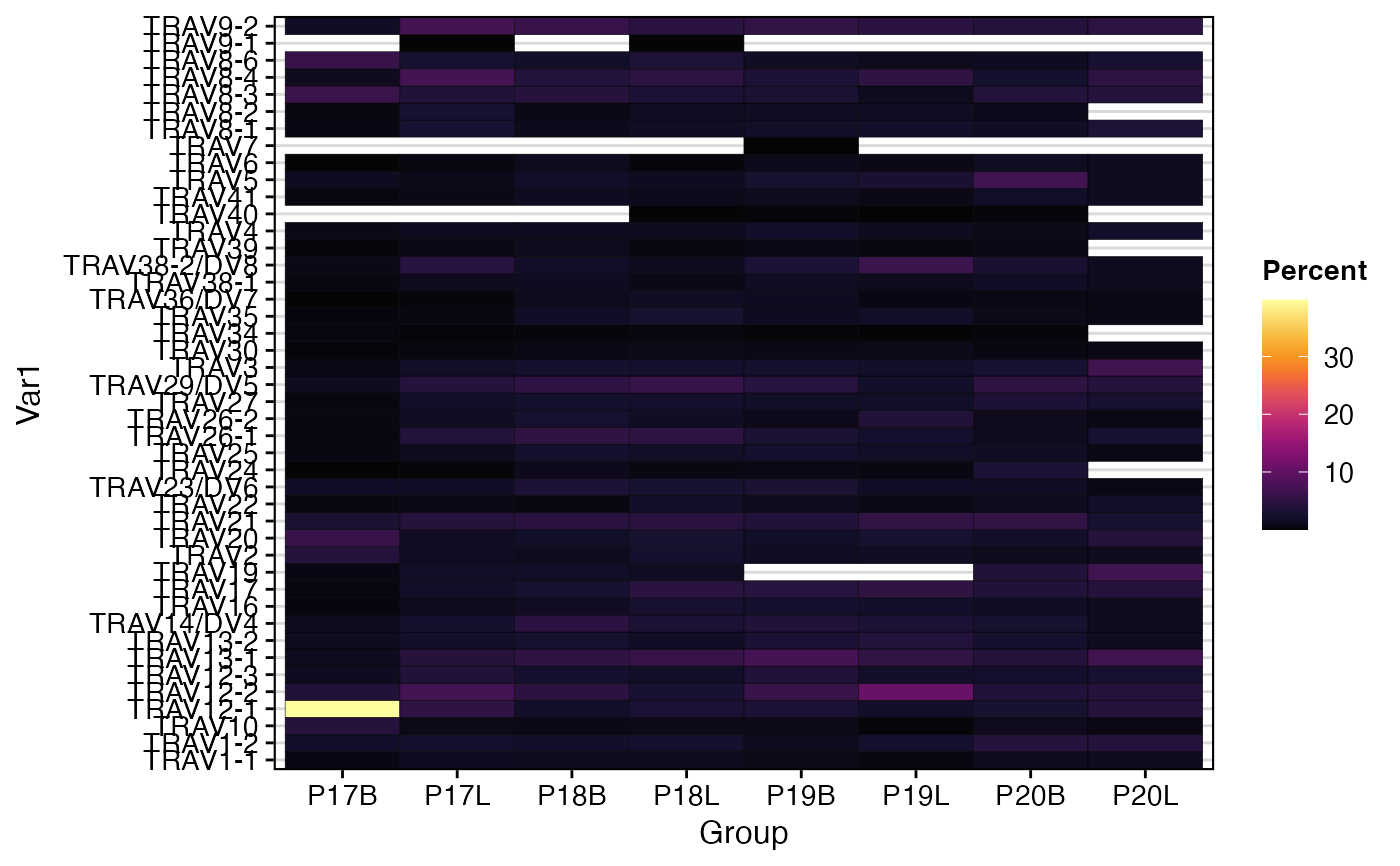
 # Quantify and visualize TRA V-gene usage as a heatmap
percentGenes(combined,
chain = "TRA",
gene = "Vgene",
group.by = "sample",
summary.fun = "percent")
# Quantify and visualize TRA V-gene usage as a heatmap
percentGenes(combined,
chain = "TRA",
gene = "Vgene",
group.by = "sample",
summary.fun = "percent")
 # Quantify TRA J-gene usage and export the table
traj_usage_table <- percentGenes(combined,
chain = "TRA",
gene = "Jgene",
group.by = "sample",
export.table = TRUE,
summary.fun = "count")
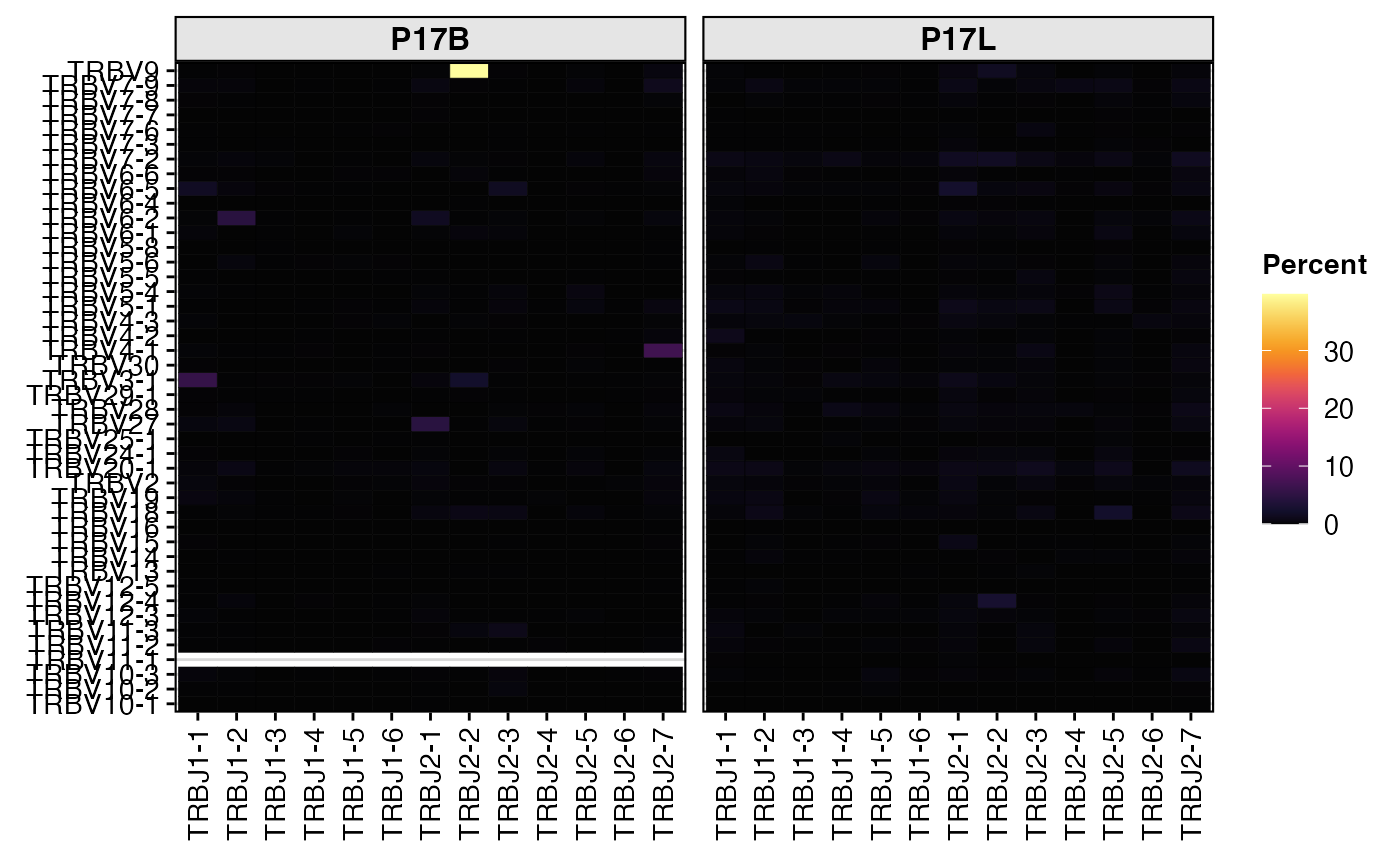
# Quantify and visualize TRB V-J gene pairings as a heatmap
percentVJ(combined[1:2],
chain = "TRB",
group.by = "sample",
summary.fun = "percent")
# Quantify TRA J-gene usage and export the table
traj_usage_table <- percentGenes(combined,
chain = "TRA",
gene = "Jgene",
group.by = "sample",
export.table = TRUE,
summary.fun = "count")
# Quantify and visualize TRB V-J gene pairings as a heatmap
percentVJ(combined[1:2],
chain = "TRB",
group.by = "sample",
summary.fun = "percent")
 # 2. Quantify TRA V-J gene pairings and export the table
trav_traj_table <- percentVJ(combined,
chain = "TRA",
group.by = "sample",
export.table = TRUE,
summary.fun = "proportion")
# 2. Quantify TRA V-J gene pairings and export the table
trav_traj_table <- percentVJ(combined,
chain = "TRA",
group.by = "sample",
export.table = TRUE,
summary.fun = "proportion")