Calculate rarefaction based on the abundance of clones
Source:R/clonalRarefaction.R
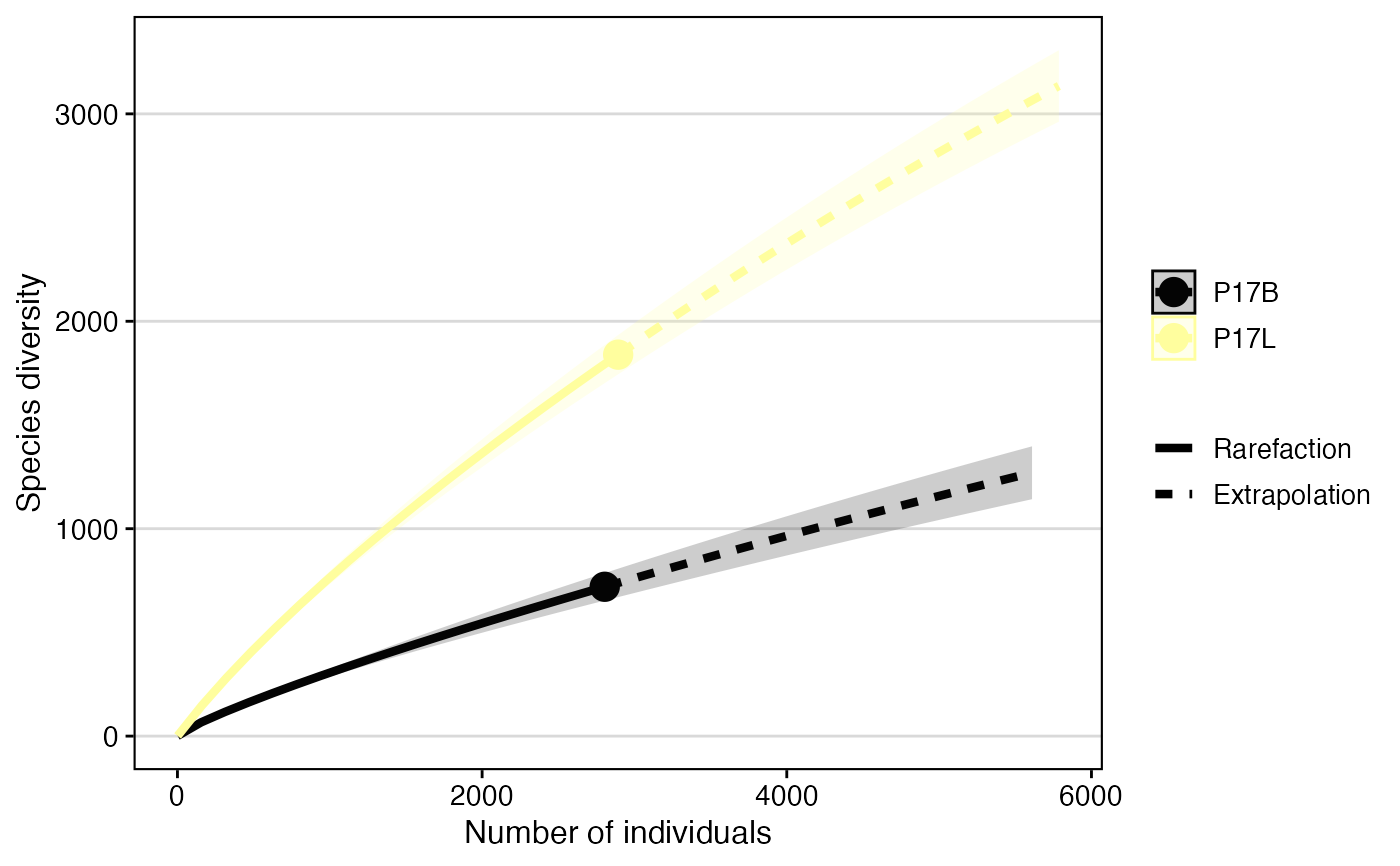
clonalRarefaction.RdThis functions uses the Hill numbers of order q: species richness (q = 0),
Shannon diversity (q = 1), the exponential of Shannon entropy and Simpson
diversity (q = 2, the inverse of Simpson concentration) to compute diversity
estimates for rarefaction and extrapolation. The function relies on the
iNEXT::iNEXT() R package. Please read and cite the
manuscript
if using this function. The input into the iNEXT calculation is abundance,
incidence-based calculations are not supported.
Usage
clonalRarefaction(
  input.data,
  clone.call = NULL,
  chain = "both",
  group.by = NULL,
  plot.type = 1,
  hill.numbers = 0,
  n.boots = 20,
  export.table = NULL,
  palette = "inferno",
  cloneCall = NULL,
  exportTable = NULL,
  ...
)
Arguments
- input.data
The product of
combineTCR(),combineBCR(), orcombineExpression().- clone.call
Defines the clonal sequence grouping. Accepted values are:
gene(VDJC genes),nt(CDR3 nucleotide sequence),aa(CDR3 amino acid sequence), orstrict(VDJC + nt). A custom column header can also be used.- chain
The TCR/BCR chain to use. Use
bothto include both chains (e.g., TRA/TRB). Accepted values:TRA,TRB,TRG,TRD,IGH,IGL,IGK,Light(for both light chains), orboth(for TRA/B and Heavy/Light).- group.by
A column header in the metadata or lists to group the analysis by (e.g., "sample", "treatment"). If
NULL, data will be analyzed by list element or active identity in the case of single-cell objects.- plot.type
sample-size-based rarefaction/extrapolation curve (
type = 1); sample completeness curve (type = 2); coverage-based rarefaction/extrapolation curve (type = 3).- hill.numbers
The Hill numbers to be plotted out (0 - species richness, 1 - Shannon, 2 - Simpson)
- n.boots
The number of bootstrap replicates used to derive confidence intervals for the diversity estimates. More replicates can provide a more reliable measure of statistical variability.
- export.table
If
TRUE, returns a data frame or matrix of the results instead of a plot.- palette
Colors to use in visualization - input any hcl.pals.
- cloneCall
![[Deprecated]](figures/lifecycle-deprecated.svg) Use
Use clone.callinstead.- exportTable
- Use
export.tableinstead. - ...
Additional arguments passed to the ggplot theme
Examples
# Making combined contig data
combined <- combineTCR(contig_list,
                        samples = c("P17B", "P17L", "P18B", "P18L",
                                    "P19B","P19L", "P20B", "P20L"))

# Using clonalRarefaction()
clonalRarefaction(combined[c(1,2)], clone.call = "gene", n.boots = 3)
#> Warning: `aes_string()` was deprecated in ggplot2 3.0.0.
#> ℹ Please use tidy evaluation idioms with `aes()`.
#> ℹ See also `vignette("ggplot2-in-packages")` for more information.
#> ℹ The deprecated feature was likely used in the iNEXT package.
#>   Please report the issue at <https://github.com/AnneChao/iNEXT/issues>.