This function utilizes the STARTRAC approach to calculate T cell
diversity metrics based on the work of Zhang et al. (2018, Nature)
PMID: 30479382. It can compute
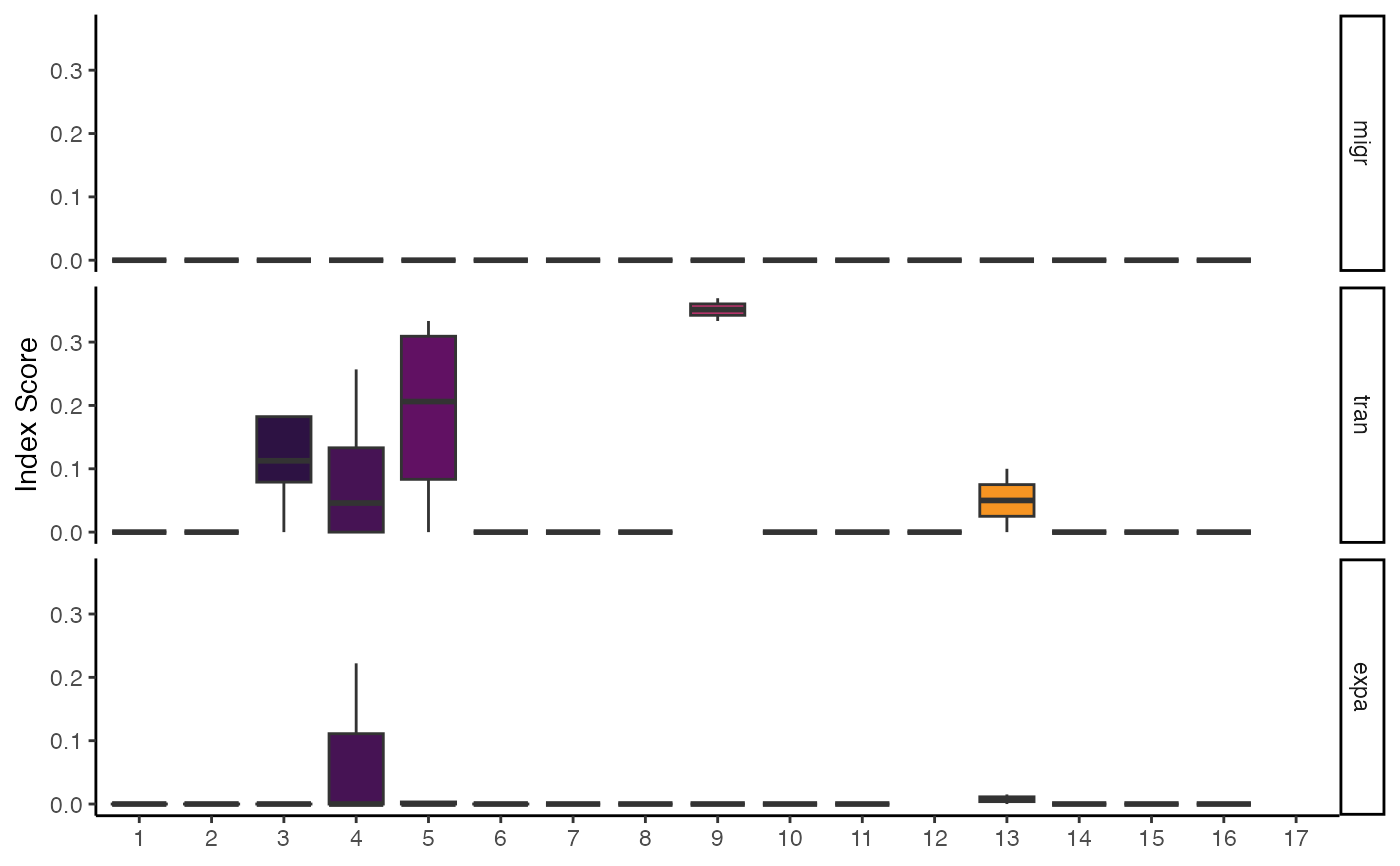
three distinct indices: clonal expansion (expa), cross-tissue migration
(migr), and state transition (tran).
Usage
StartracDiversity(
  sc.data,
  clone.call = NULL,
  chain = "both",
  index = c("expa", "migr", "tran"),
  type = NULL,
  group.by = NULL,
  pairwise = NULL,
  export.table = NULL,
  palette = "inferno",
  cloneCall = NULL,
  exportTable = NULL,
  ...
)
Arguments
- sc.data
The single-cell object after
combineExpression(). For SCE objects, the cluster variable must be in the meta data under "cluster".- clone.call
Defines the clonal sequence grouping. Accepted values are:
gene(VDJC genes),nt(CDR3 nucleotide sequence),aa(CDR3 amino acid sequence), orstrict(VDJC + nt). A custom column header can also be used.- chain
The TCR/BCR chain to use. Use
bothto include both chains (e.g., TRA/TRB). Accepted values:TRA,TRB,TRG,TRD,IGH,IGL,IGK,Light(for both light chains), orboth(for TRA/B and Heavy/Light).- index
A character vector specifying which indices to calculate. Options: "expa", "migr", "tran". Default is all three.
- type
The metadata variable that specifies tissue type for migration analysis.
- group.by
A column header in the metadata or lists to group the analysis by (e.g., "sample", "treatment"). If
NULL, data will be analyzed as by list element or active identity in the case of single-cell objects.- pairwise
The metadata column to be used for pairwise comparisons. Set to the
typevariable for pairwise migration or "cluster" for pairwise transition.- export.table
If
TRUE, returns a data frame or matrix of the results instead of a plot.- palette
Colors to use in visualization - input any hcl.pals.
- cloneCall
![[Deprecated]](figures/lifecycle-deprecated.svg) Use
Use clone.callinstead.- exportTable
- Use
export.tableinstead. - ...
Additional arguments passed to the ggplot theme
Details
The function requires a type variable in the metadata, which specifies the
tissue origin or any other categorical variable for migration analysis.
Indices:
expa (Clonal Expansion): Measures the extent of clonal proliferation within a T cell cluster. It is calculated as
1 - normalized Shannon entropy. A higher value indicates greater expansion of a few clones.migr (Cross-Tissue Migration): Quantifies the movement of clonal T cells across different tissues (as defined by the
typeparameter). It is based on the entropy of a clonotype's distribution across tissues.tran (State Transition): Measures the developmental transition of clonal T cells between different functional clusters. It is based on the entropy of a clonotype's distribution across clusters.
Pairwise Analysis:
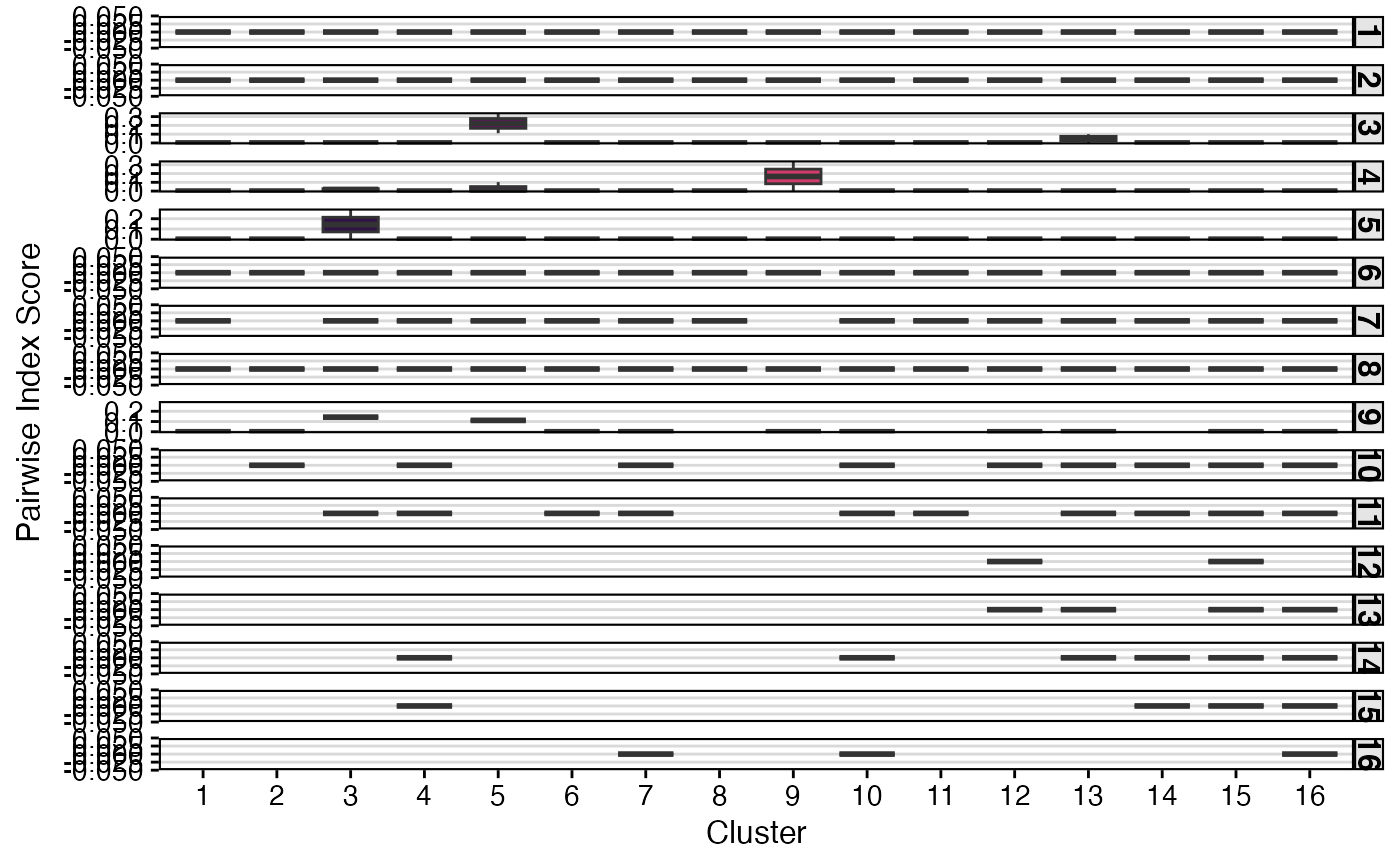
The pairwise parameter enables the calculation of migration or transition
between specific pairs of tissues or clusters, respectively.
For migration (
index = "migr"), setpairwiseto thetypecolumn (e.g.,pairwise = "Type").For transition (
index = "tran"), setpairwiseto"cluster".
Examples
# Getting the combined contigs
combined <- combineTCR(contig_list,
                        samples = c("P17B", "P17L", "P18B", "P18L",
                                    "P19B","P19L", "P20B", "P20L"))

# Getting a sample of a Seurat object
scRep_example  <- get(data("scRep_example"))
scRep_example  <- combineExpression(combined, scRep_example)
scRep_example$Patient <- substring(scRep_example$orig.ident,1,3)
scRep_example$Type <- substring(scRep_example$orig.ident,4,4)

# Calculate a single index (expansion)
StartracDiversity(scRep_example,
                  type = "Type",
                  group.by = "Patient",
                  index = "expa")


# Calculate pairwise transition
StartracDiversity(scRep_example,
                  type = "Type",
                  group.by = "Patient",
                  index = "tran",
                  pairwise = "cluster")
# Calculate pairwise transition
StartracDiversity(scRep_example,
type = "Type",
group.by = "Patient",
index = "tran",
pairwise = "cluster")