This function the proportion V or J genes used by
grouping variables. This function only quantifies
single gene loci for indicated chain. For
examining VJ pairing, please see percentVJ().
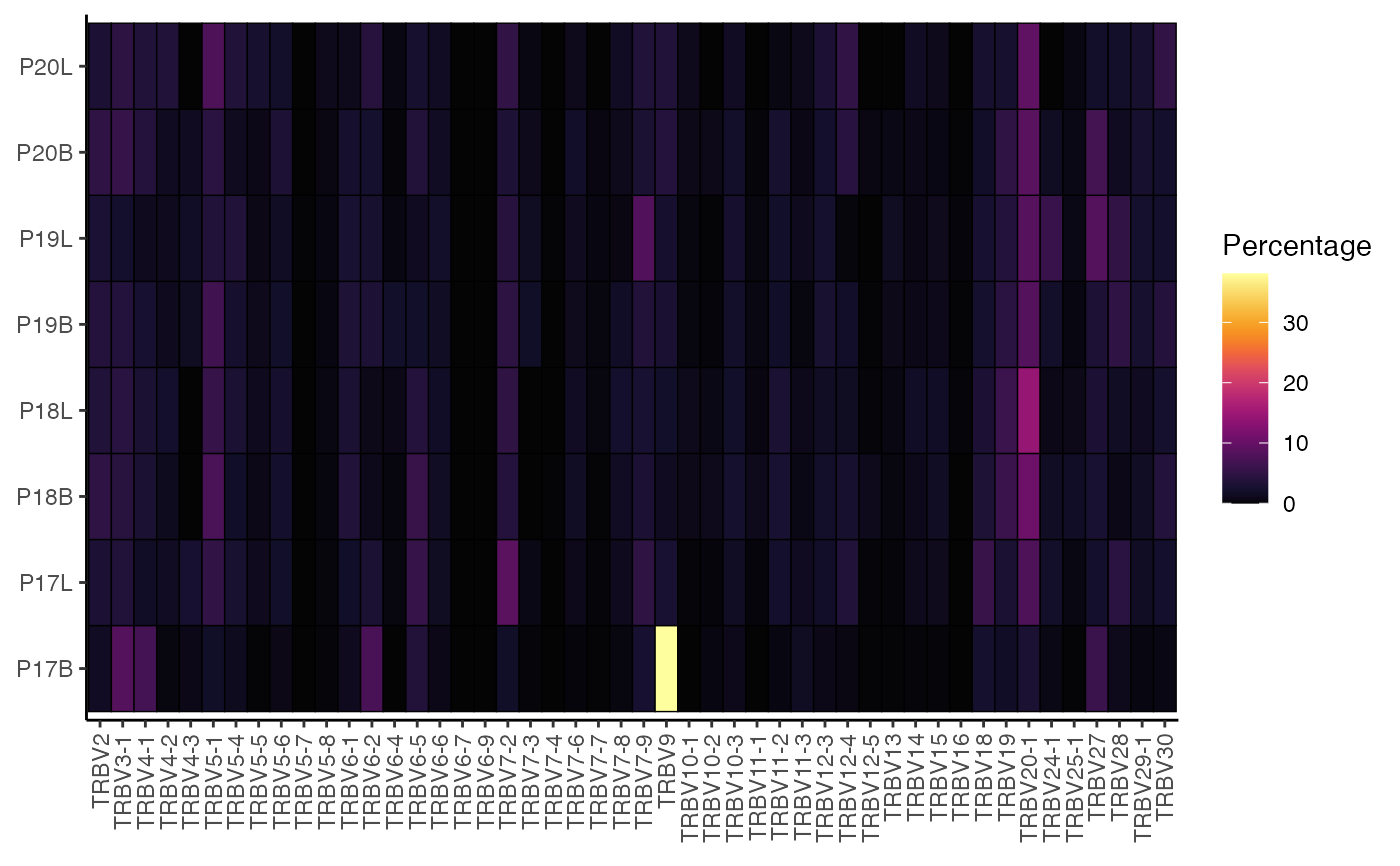
percentGenes(
  input.data,
  chain = "TRB",
  gene = "Vgene",
  group.by = NULL,
  order.by = NULL,
  exportTable = FALSE,
  palette = "inferno"
)
Arguments
- input.data
The product of
combineTCR(),combineBCR(), orcombineExpression().- chain
"TRA", "TRB", "TRG", "TRG", "IGH", "IGL".
- gene
"V", "D" or "J"
- group.by
The variable to use for grouping
- order.by
A vector of specific plotting order or "alphanumeric" to plot groups in order
- exportTable
Returns the data frame used for forming the graph.
- palette
Colors to use in visualization - input any hcl.pals.
Value
ggplot of percentage of indicated genes as a heatmap
Examples
#Making combined contig data
combined <- combineTCR(contig_list,
                        samples = c("P17B", "P17L", "P18B", "P18L",
                                    "P19B","P19L", "P20B", "P20L"))
percentGenes(combined,
             chain = "TRB",
             gene = "Vgene")