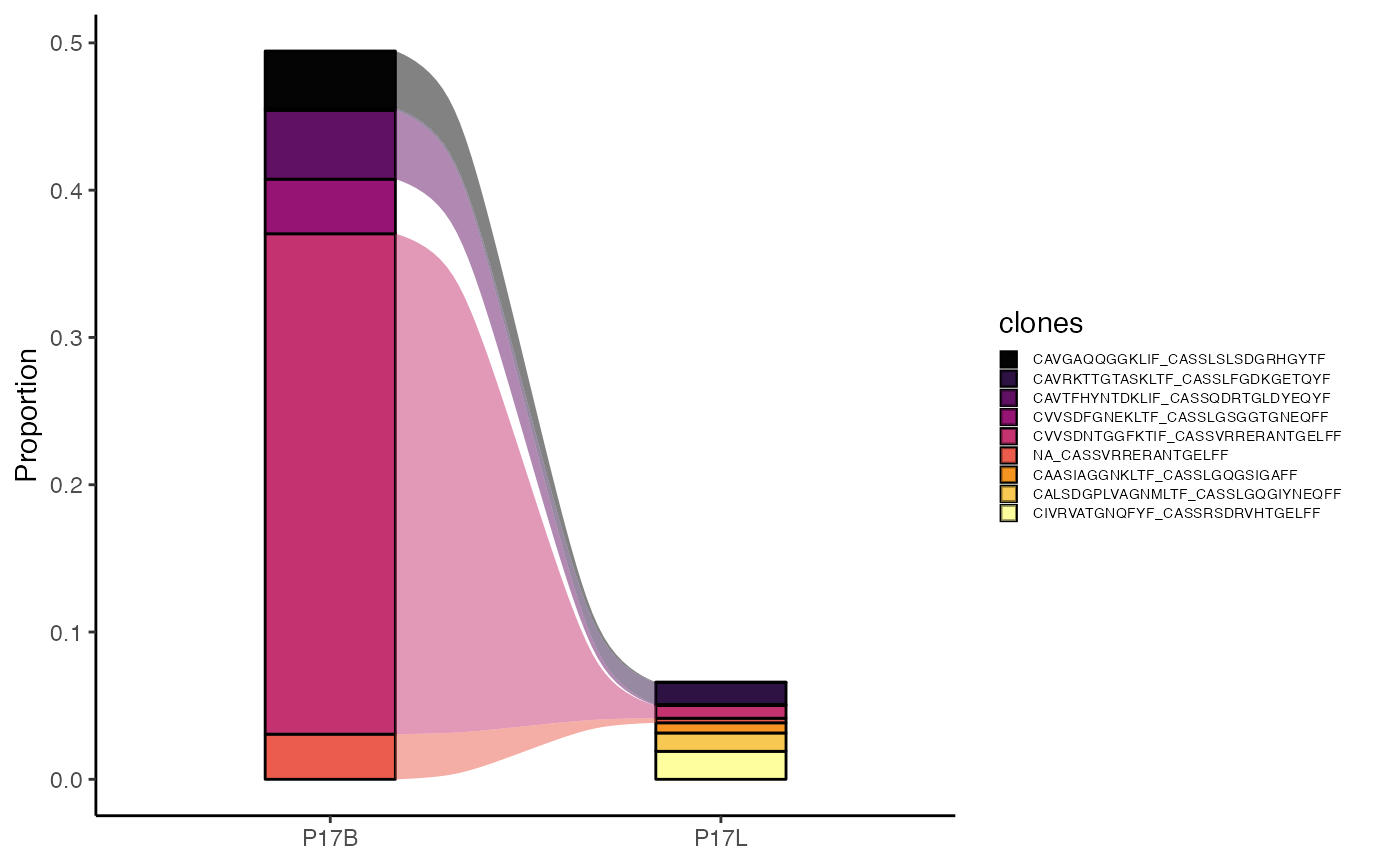
This function visualizes the relative abundance of specific clones across different samples or groups. It is useful for tracking how the proportions of top clones change between conditions. The output can be an alluvial plot to trace clonal dynamics or an area plot to show compositional changes.
Usage
clonalCompare(
  input.data,
  clone.call = NULL,
  chain = "both",
  samples = NULL,
  clones = NULL,
  top.clones = NULL,
  highlight.clones = NULL,
  relabel.clones = FALSE,
  group.by = NULL,
  order.by = NULL,
  graph = "alluvial",
  proportion = TRUE,
  export.table = NULL,
  palette = "inferno",
  cloneCall = NULL,
  exportTable = NULL,
  ...
)
Arguments
- input.data
The product of
combineTCR,combineBCR, orcombineExpression.- clone.call
Defines the clonal sequence grouping. Accepted values are:
gene(VDJC genes),nt(CDR3 nucleotide sequence),aa(CDR3 amino acid sequence), orstrict(VDJC + nt). A custom column header can also be used.- chain
The TCR/BCR chain to use. Use
bothto include both chains (e.g., TRA/TRB). Accepted values:TRA,TRB,TRG,TRD,IGH,IGL,IGK,Light(for both light chains), orboth(for TRA/B and Heavy/Light).- samples
The specific samples to isolate for visualization.
- clones
The specific clonal sequences of interest
- top.clones
The top number of clonal sequences per group. (e.g., top.clones = 5)
- highlight.clones
Clonal sequences to highlight, if present, all other clones returned will be grey
- relabel.clones
Simplify the legend of the graph by returning clones that are numerically indexed
- group.by
A column header in the metadata or lists to group the analysis by (e.g., "sample", "treatment"). If
NULL, data will be analyzed by list element or active identity in the case of single-cell objects.- order.by
A character vector defining the desired order of elements of the
group.byvariable. Alternatively, usealphanumericto sort groups automatically.- graph
The type of plot to generate. Accepted values are
alluvial(default) orarea- proportion
If
TRUE(default), the y-axis will represent the proportional abundance of clones. IfFALSE, the y-axis will represent raw clone counts.`- export.table
If
TRUE, returns a data frame or matrix of the results instead of a plot.- palette
Colors to use in visualization - input any hcl.pals
- cloneCall
![[Deprecated]](figures/lifecycle-deprecated.svg) Use
Use clone.callinstead.- exportTable
- Use
export.tableinstead. - ...
Additional arguments passed to the ggplot theme
Value
A ggplot object visualizing proportions of clones by groupings, or a
data.frame if export.table = TRUE.
Examples
# Making combined contig data
combined <- combineTCR(contig_list,
                       samples = c("P17B", "P17L", "P18B", "P18L",
                                   "P19B","P19L", "P20B", "P20L"))

# Using clonalCompares()
clonalCompare(combined,
              top.clones = 5,
              samples = c("P17B", "P17L"),
              clone.call = "aa")