Plot Antibody Data with Optional Antigen-Level Table or Time-Series Trend
Source:R/plotAntibodies.R
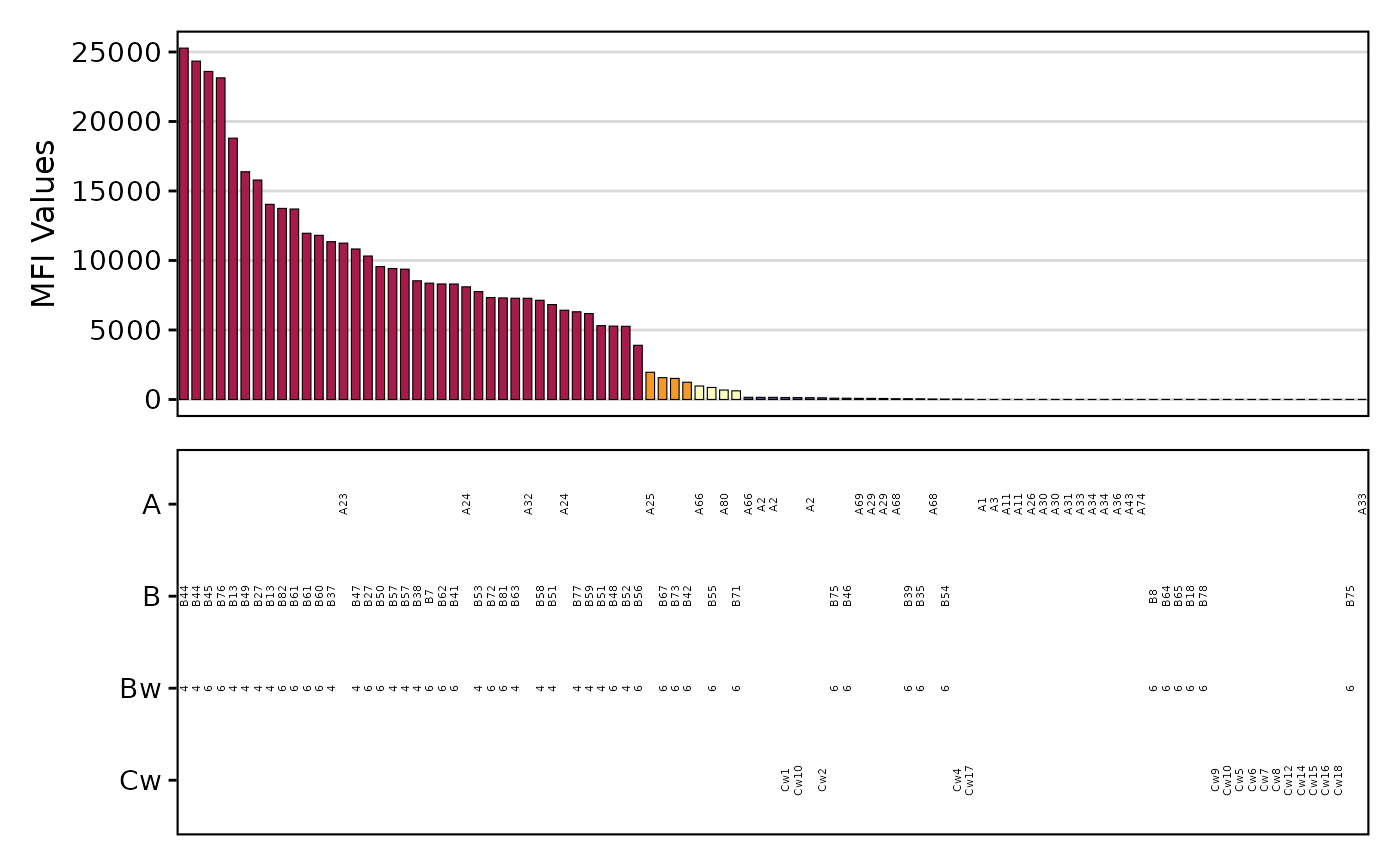
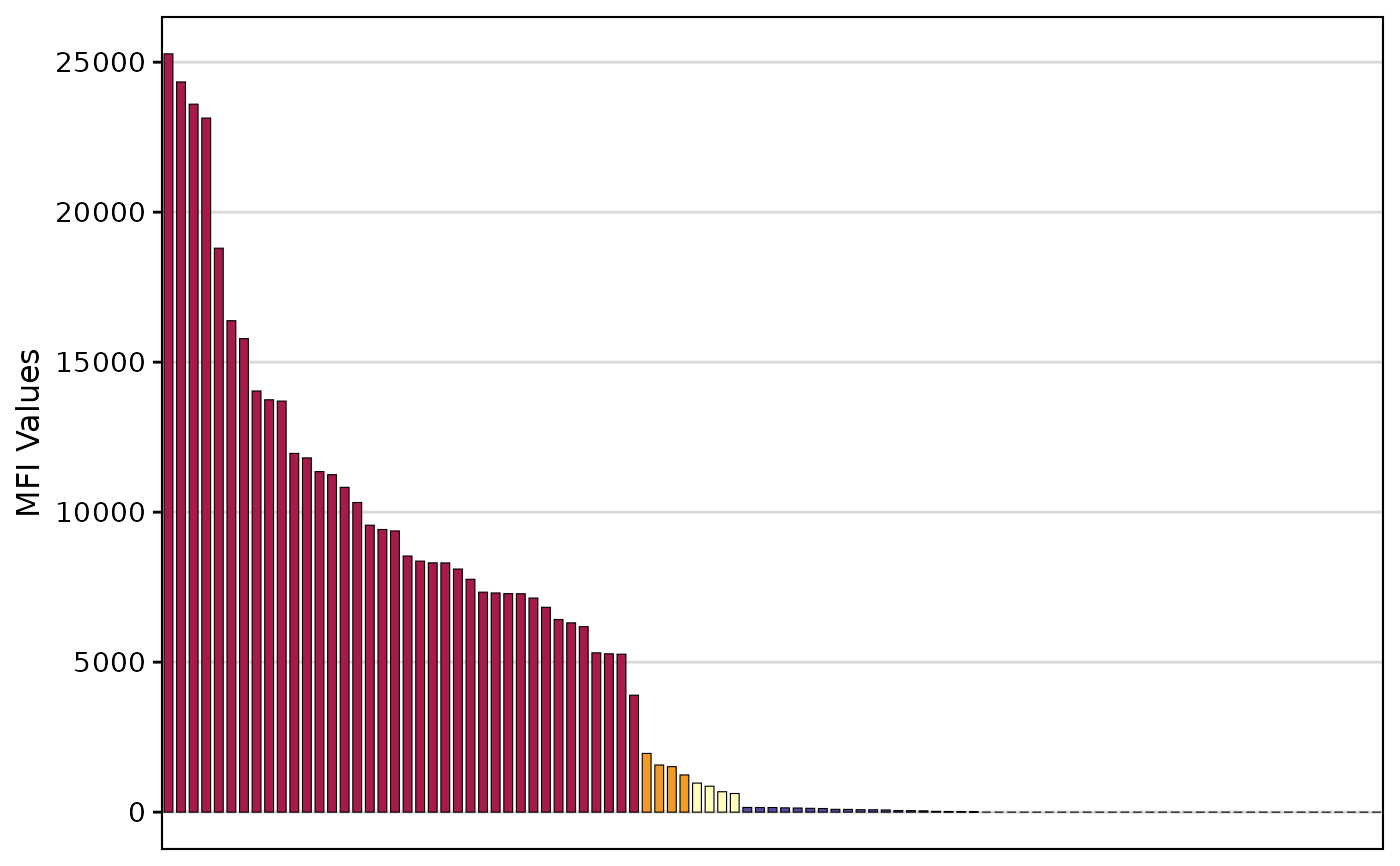
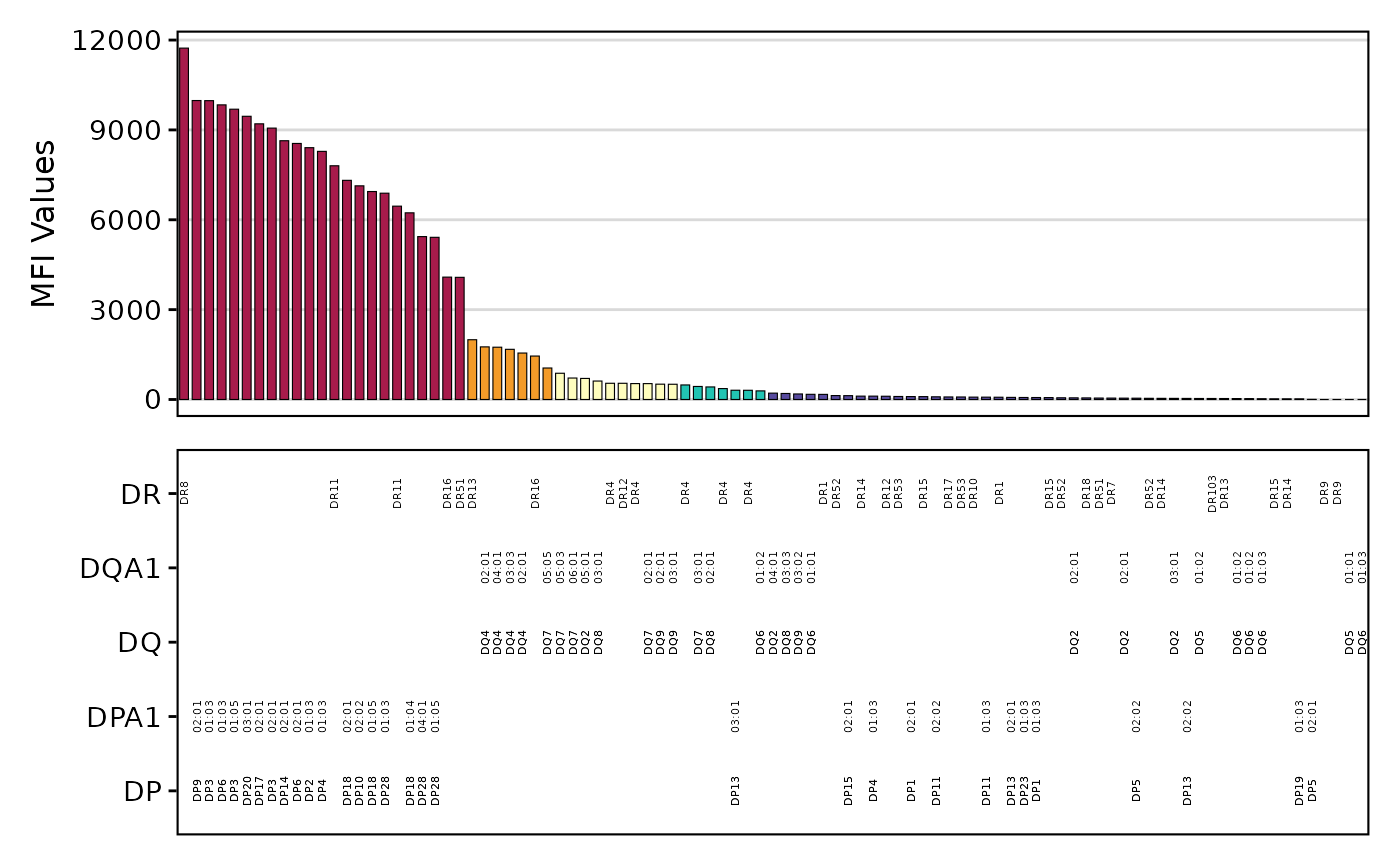
plotAntibodies.RdThis function generates a bar plot of SAB (Single Antigen Beads) or PRA (Panel-Reactive Antibody) results from a provided data frame or a file path. It can also plot MFI values over time.
Usage
plotAntibodies(
  result_file,
  type = "SAB",
  class = "I",
  plot_trend = FALSE,
  bead_cutoffs = NULL,
  highlight_threshold = 2000,
  vline_dates = NULL,
  add_table = TRUE,
  x_text_angle = 90,
  palette = "spectral",
  highlight_antigen = NULL,
  ...
)

plotSAB(..., type = "SAB")

plotPRA(..., type = "PRA")
Arguments
- result_file
A data frame, a list of data frames (for trend plot), or a character string specifying the path to a file in CSV, XLS, or XLSX format.
- type
Character. The type of assay, either "SAB" or "PRA". Defaults to "SAB".
- class
Character. For PRA plots, the class of the assay, either "I" or "II". Defaults to "I".
- plot_trend
Logical. If TRUE, a time-series plot is generated. Defaults to FALSE.
- bead_cutoffs
Numeric vector. Cutoff values for categorizing MFI values. Defaults to `c(2000, 1000, 500, 250)` for SAB and `c(1500, 1000, 500, 250)` for PRA.
- highlight_threshold
Numeric. MFI threshold for highlighting alleles in the trend plot. Defaults to 2000.
- vline_dates
Vector of dates. Dates to draw vertical lines on the trend plot.
- add_table
Logical. Whether to add the antigen-level information as a table to the bottom of the bar plot. Defaults to TRUE.
- x_text_angle
Numeric. Angle for the antigen/allele text in the table. Defaults to 90.
- palette
Character. A color palette name. Defaults to "spectral".
- highlight_antigen
Character vector. Optional antigen(s) to highlight.
- ...
Additional arguments passed to the ggplot theme.