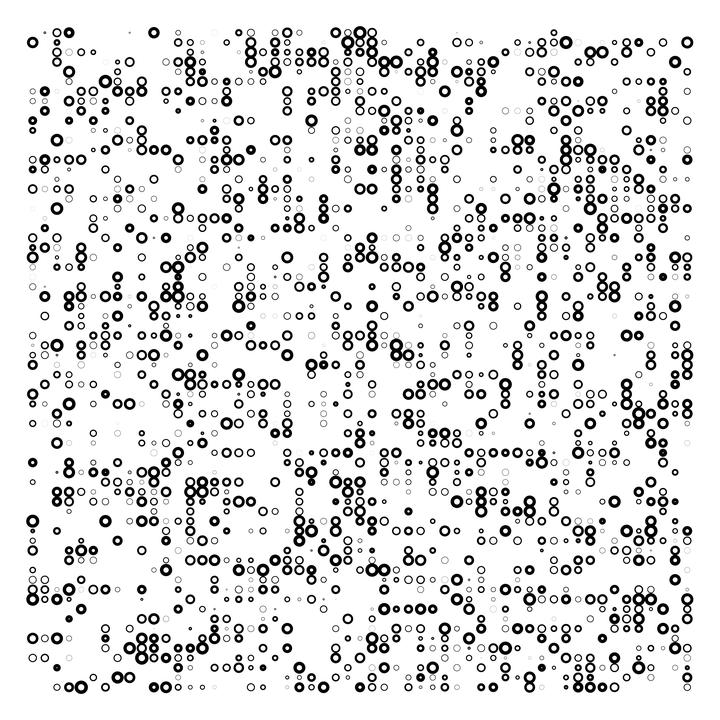
Binary Genetics

Using R does not have to be for work alone. There are a number of individuals using R for generative art - Thomas Lin Pederson is probably the best example I have seen. Here is a small contribution to enjoying data science for no other reason than making something interesting.
Getting Target Sequence
We will pull the coding sequence for the human BRCA1 gene using the ensembl/BiomaRt pipeline.
library(biomaRt)
mart <- useMart("ensembl", dataset="hsapiens_gene_ensembl")

seq = getSequence(id = "BRCA1",
                  type = "hgnc_symbol",
                  seqType = "coding",
                  mart = mart)

seq1 <- seq$coding[1] # First Sequence
num.char <- nchar(seq1)
seq1 <- strsplit(seq1, "")[[1]]
Translating the Sequence to Binary
Using the DNA sequence, we can translate the nucleotides to 2 bits of data. For sanity I am doing it in the alphabetical order, but any order for the binary translation would work. In the end, the DNA sequence will be a series of 0s and 1s that we will plot.
# Binary Cipher
A = "00"
C = "01"
G = "10"
T = "11"
translator <- list("A"=A,"C" = C,"G" = G,"T" = T)


for (i in seq_len(num.char)) {
  tmp.bin <- unlist(translator[seq1[i]])
  if(i == 1) {
    bin.sequence <- tmp.bin
  } else {
    bin.sequence <- c(bin.sequence, tmp.bin)
  }
}
Defining Plot Coordinates
In order to plot the binarized gene sequence into a square, we need to define x and y coordinates along the sequence.
divisors <- function(x){
  #  Vector of numbers to test against
  y <- seq_len(x)
  #  Modulo division. If remainder is 0 that number is a divisor of x so return it
  y[ x%%y == 0 ]
}

######################
# Plotting data frame
######################
set.seed(42) #For Reproducibility
x <- strsplit(paste(bin.sequence, collapse = ""), "")[[1]]
position <- seq(1,length(x)) #Specific Nucleotide
#Added Texture by varying stroke and size of dots
stroke <- sample(seq(0.05,5,0.05), length(x), replace = TRUE)
size = sample(seq(0.05,1,0.05), length(x), replace = TRUE)
df <- data.frame(x,position,stroke, size)
df$row <- NA
df$column <- NA

################################################
#Getting X and Y coordinates for Each Nucleotide
###############################################

div <- divisors(length(x))
div.position <- round(length(divisors(length(x)))/2)
divider <- div[div.position]

x.pos <- seq(1, length(x), divider)

num.column <- length(x)/divider #How far in the x position to go
y.pos <- seq(1, length(x), num.column)

col.ref <- seq_len(num.column)

#X position calculation
for (i in seq_len(num.column)) {
  if(i == num.column) {
    df$row[x.pos[i]:c(length(x))] <- i
  }else {
  df$row[x.pos[i]:c(x.pos[i+1]-1)] <- i
  }
}

for (i in seq_len(divider)) {
  pos <- c(x.pos + i -1)
  df$column[(pos)] <- i
}

#Binary designation - plot if x = 1
df$plot <- ifelse(df$x == 1, 1, NA)
Plotting the Gene
Now we can finally plot the gene using the column and row positions we have calculated above. Notice we are actually plotting the subset of the data frame that does not have NA values (these NAs correspond to 0s).
library(ggplot2)
ggplot(subset(df, !is.na(plot)), aes(x=column, y = row)) +
  geom_point(aes(size = size, stroke = stroke,), shape = 21) +
  guides(size = "none") +
  theme_void()
