TCRpheno
I happened upon this preprint the other day examining latent cell fate information within the TCR sequences. Naturally, my first thought was to apply the approach from Lagattuta et el to the single-cell objects I have. Here is an example of how to easily implement the TCRpheno. Please check out the preprint and code repository - there are some really interesting findings on memory formation.
Loading Libraries and Functions
We will first need to load scRepertoire and tcrpheno and make a function to organize the TCR sequences into a compatible format for tcrpheno.
The tcrpheno models can be installed using:
remotes::install_github("kalaga27/tcrpheno")
We can load the tcrpheno and the rest of the packages/function we need with:
library(scRepertoire)
library(tcrpheno)
library(Seurat)
library(stringr)
library(viridis)
library(scCustomize)
library(patchwork)

convert.contigs <- function(data) {
#extracting TCR chain info from single-cell object meta data
if (inherits(x=data, what ="Seurat") |
    inherits(x=data, what ="SummarizedExperiment")) {
  if (inherits(x=data, what ="Seurat")) {
    dat <- data[[]]
  } else if (inherits(x=data, what ="SummarizedExperiment")){
    dat <- data.frame(colData(data))
    rownames(dat) <- data@colData@rownames
  }
  dat$cdr3_aa1 <- str_split(dat$CTaa, "_", simplify = TRUE)[,1]
  dat$cdr3_aa2 <- str_split(dat$CTaa, "_", simplify = TRUE)[,2]
  dat$cdr3_nt1 <- str_split(dat$CTnt, "_", simplify = TRUE)[,1]
  dat$cdr3_nt2 <- str_split(dat$CTnt, "_", simplify = TRUE)[,2]
  dat$TCR1 <- str_split(dat$CTgene, "_", simplify = TRUE)[,1]
  dat$TCR2 <- str_split(dat$CTgene, "_", simplify = TRUE)[,2]
  dat <- list(dat)
} else {
  dat <- data
  dat <- if(is(dat)[1] != "list") list(dat) else df
}
#Reorganizing the data frame for tcrpeheno
contigs <- lapply(dat, function(x) {
        cell <- x[,"barcode"]
        TCRA_cdr3aa <-  x[,"cdr3_aa1"]
        TCRA_vgene <- str_split(x[,"TCR1"], "[.]", simplify = T)[,1]
        TCRA_jgene <- str_split(x[,"TCR1"], "[.]", simplify = T)[,2]
        TCRA_cdr3nt <-  x[,"cdr3_nt1"]
        TCRB_cdr3aa <-  x[,"cdr3_aa2"]
        TCRB_vgene <- str_split(x[,"TCR2"], "[.]", simplify = T)[,1]
        TCRB_jgene <- str_split(x[,"TCR2"], "[.]", simplify = T)[,2]
        TCRB_cdr3nt <-  x[,"cdr3_nt2"]
        tmp <- cbind.data.frame(cell, TCRA_cdr3aa, TCRA_vgene, TCRA_jgene, TCRA_cdr3nt, TCRB_cdr3aa, TCRB_vgene, TCRB_jgene, TCRB_cdr3nt)
        tmp[tmp == ""] <- NA
        tmp
      })
    contigs <- bind_rows(contigs)
    return(contigs)
}
Loading the Contigs and Seurat Object
We will use the data set that is built into scRepertoire - 3 ccRCC patients with paired tumor and peripheral blood.
#Grab the Seurat Object
seurat <- Seurat::UpdateSeuratObject(get(load("~/seurat2.rda")))
#Can directly download the seurat object using:
#seurat <- readRDS(url("https://drive.google.com/uc?export=download&id=1wqakP2JQz9B62ofMfjWD0MB2SyPPoDE-&confirm=t&uuid=d4b1a2bc-465b-4c41-8258-5d4b100f1cbb&at=ANzk5s7lfBxMcg-RPpDFo6zykmXv:1682179250290"))

#Get contigs
contig_list <- scRepertoire::contig_list
Processing contigs and combining with Single-cell object
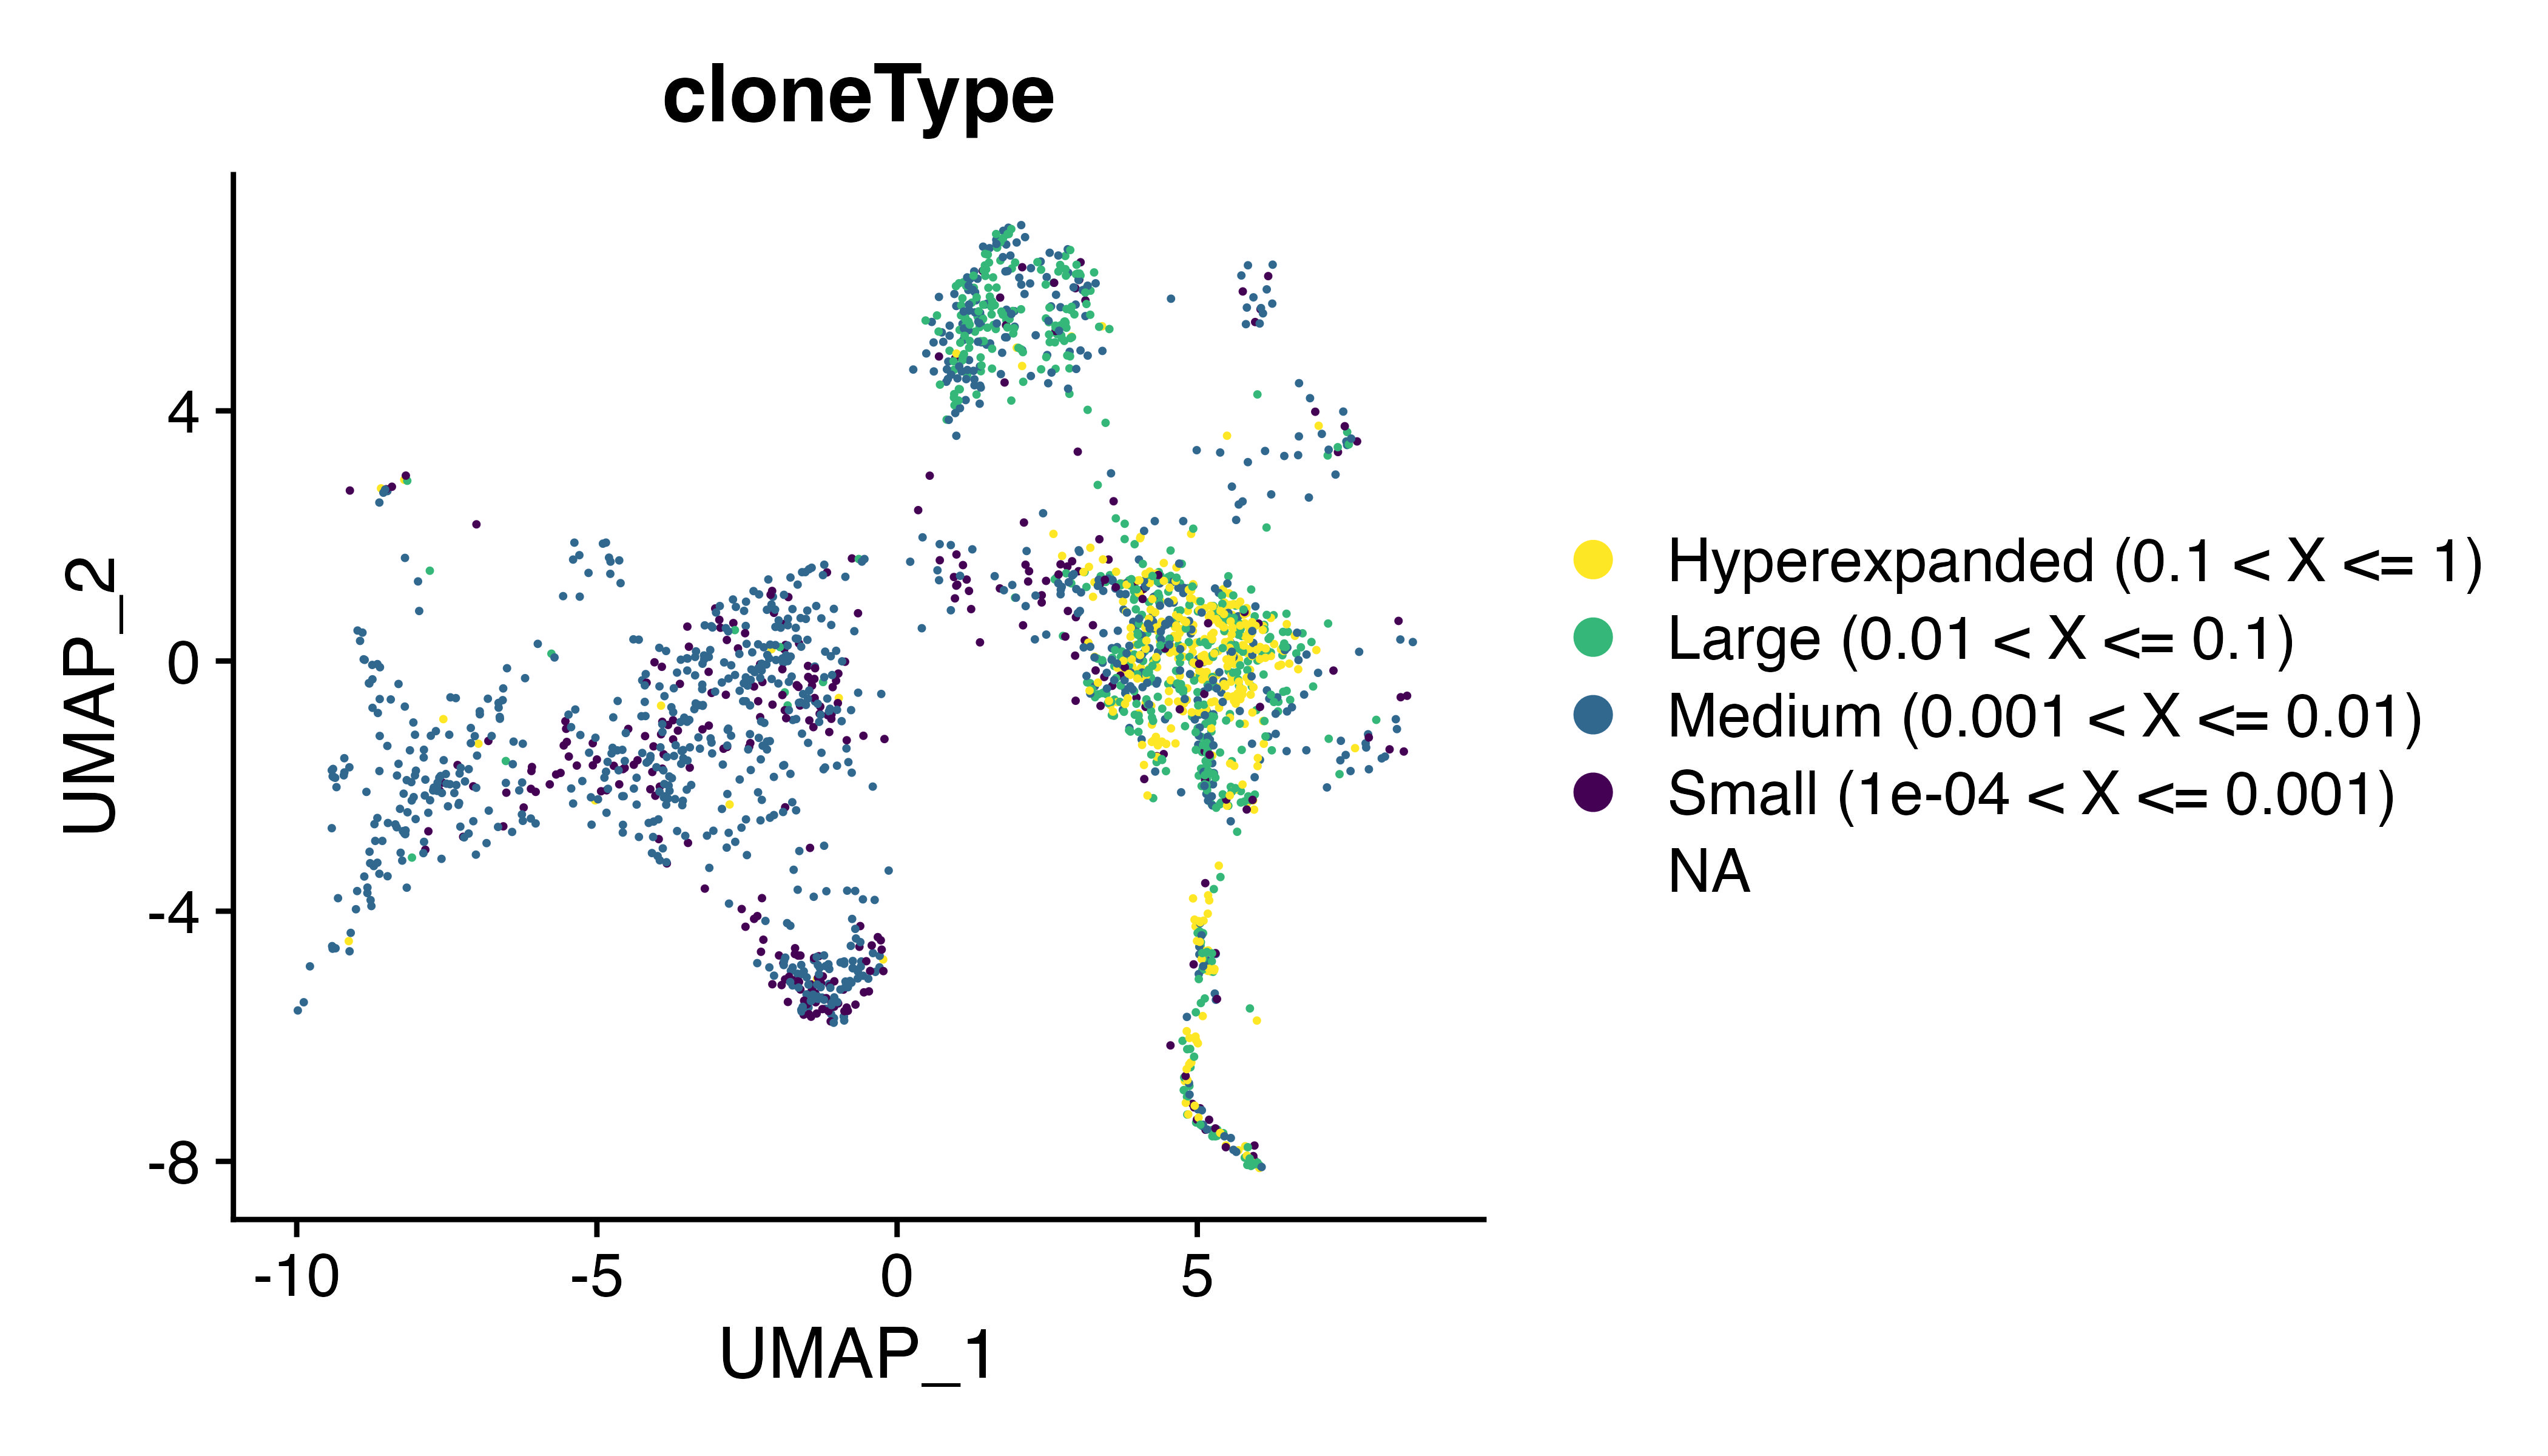
Attaching TCRs to single-cell experiments is a 2 step process with scRepertoire - 1) combineTCR() organizes the contigs by barcode. When calling this function, we will also change the default parameters of filterMulti to TRUE and removeNA to TRUE. This will return barcodes with clonotypes assigned by the highest expressing chain and remove any barcodes that are missing 1 or more chains. We can then look at the distribution and level of expansion along our UMAP.
combined.TCRs <- combineTCR(contig_list,
                             samples = rep(c("PX", "PY", "PZ"), each=2),
                             ID = rep(c("P", "T"), 3),
                             filterMulti = TRUE,
                             removeNA = TRUE)

seurat <- combineExpression(combined.TCRs, seurat)
DimPlot(seurat, group.by = "cloneType") + scale_color_viridis(discrete = TRUE, direction = -1)
Running tcrpheno
I ran into an issue here about the way beta chains are converted - for now we can apply tcrpheno on just the alpha chains.
extracted.TCRs <- convert.contigs(seurat)
extracted.TCRs <- na.omit(extracted.TCRs)
tcrpheno.results <- score_tcrs(extracted.TCRs, "a")
seurat <- AddMetaData(seurat, tcrpheno.results)
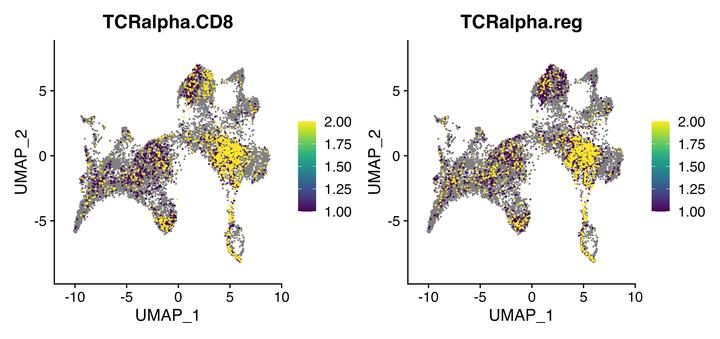
FeaturePlot(seurat, c("TCRalpha.CD8", "TCRalpha.reg"), cols = viridis_pal()(10), order = TRUE)
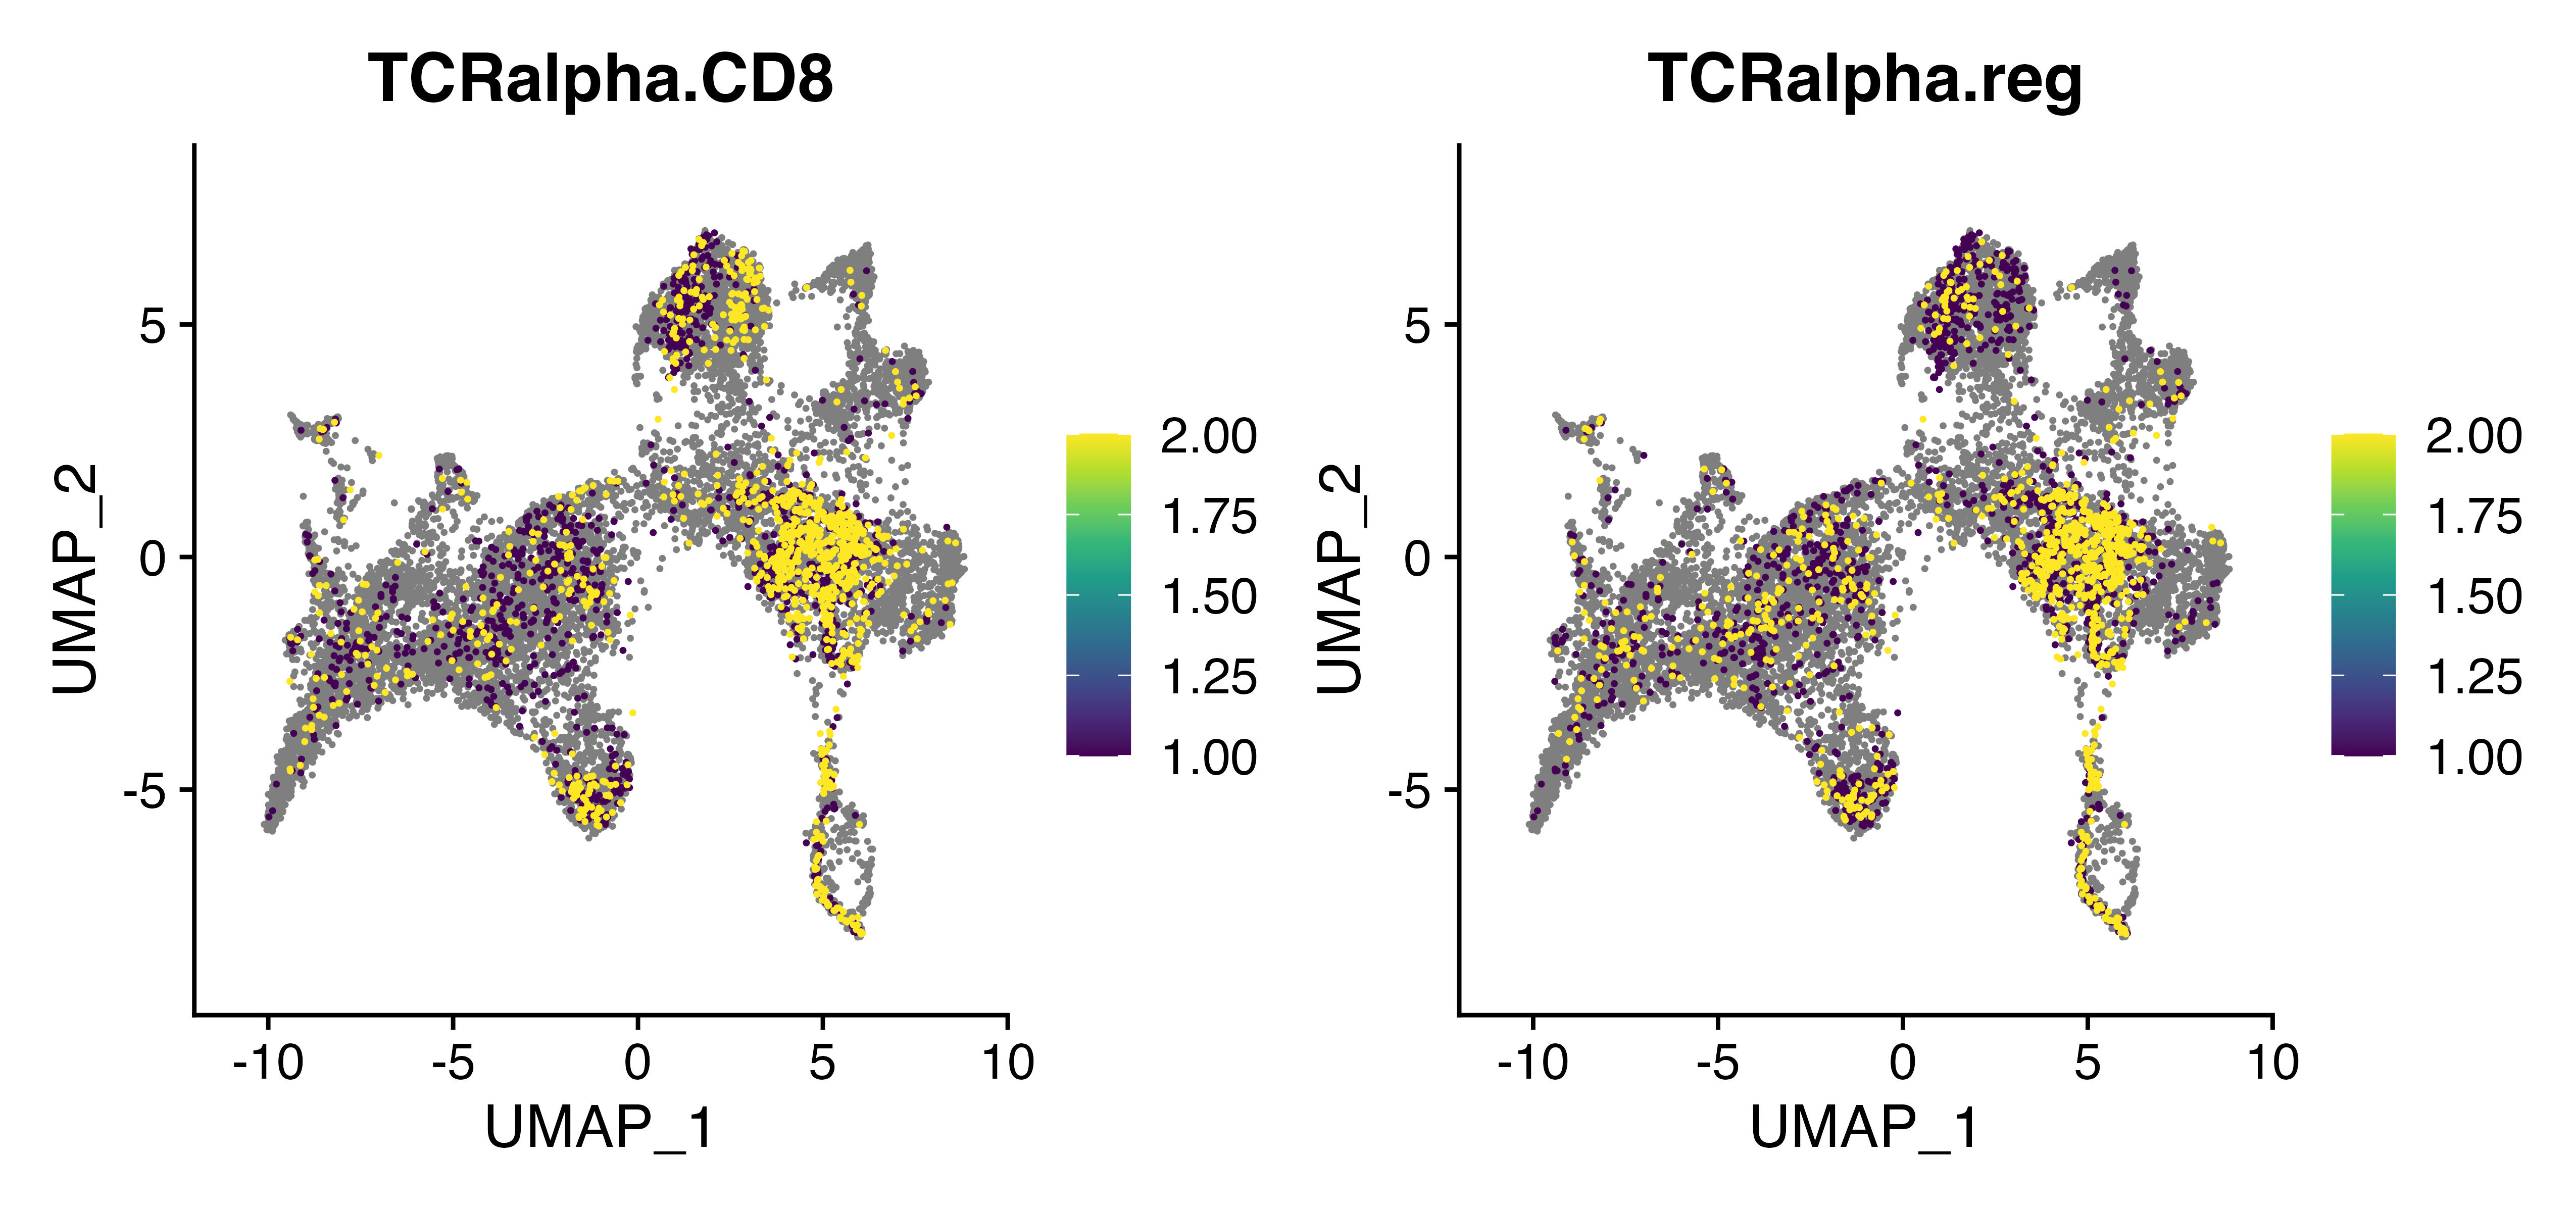
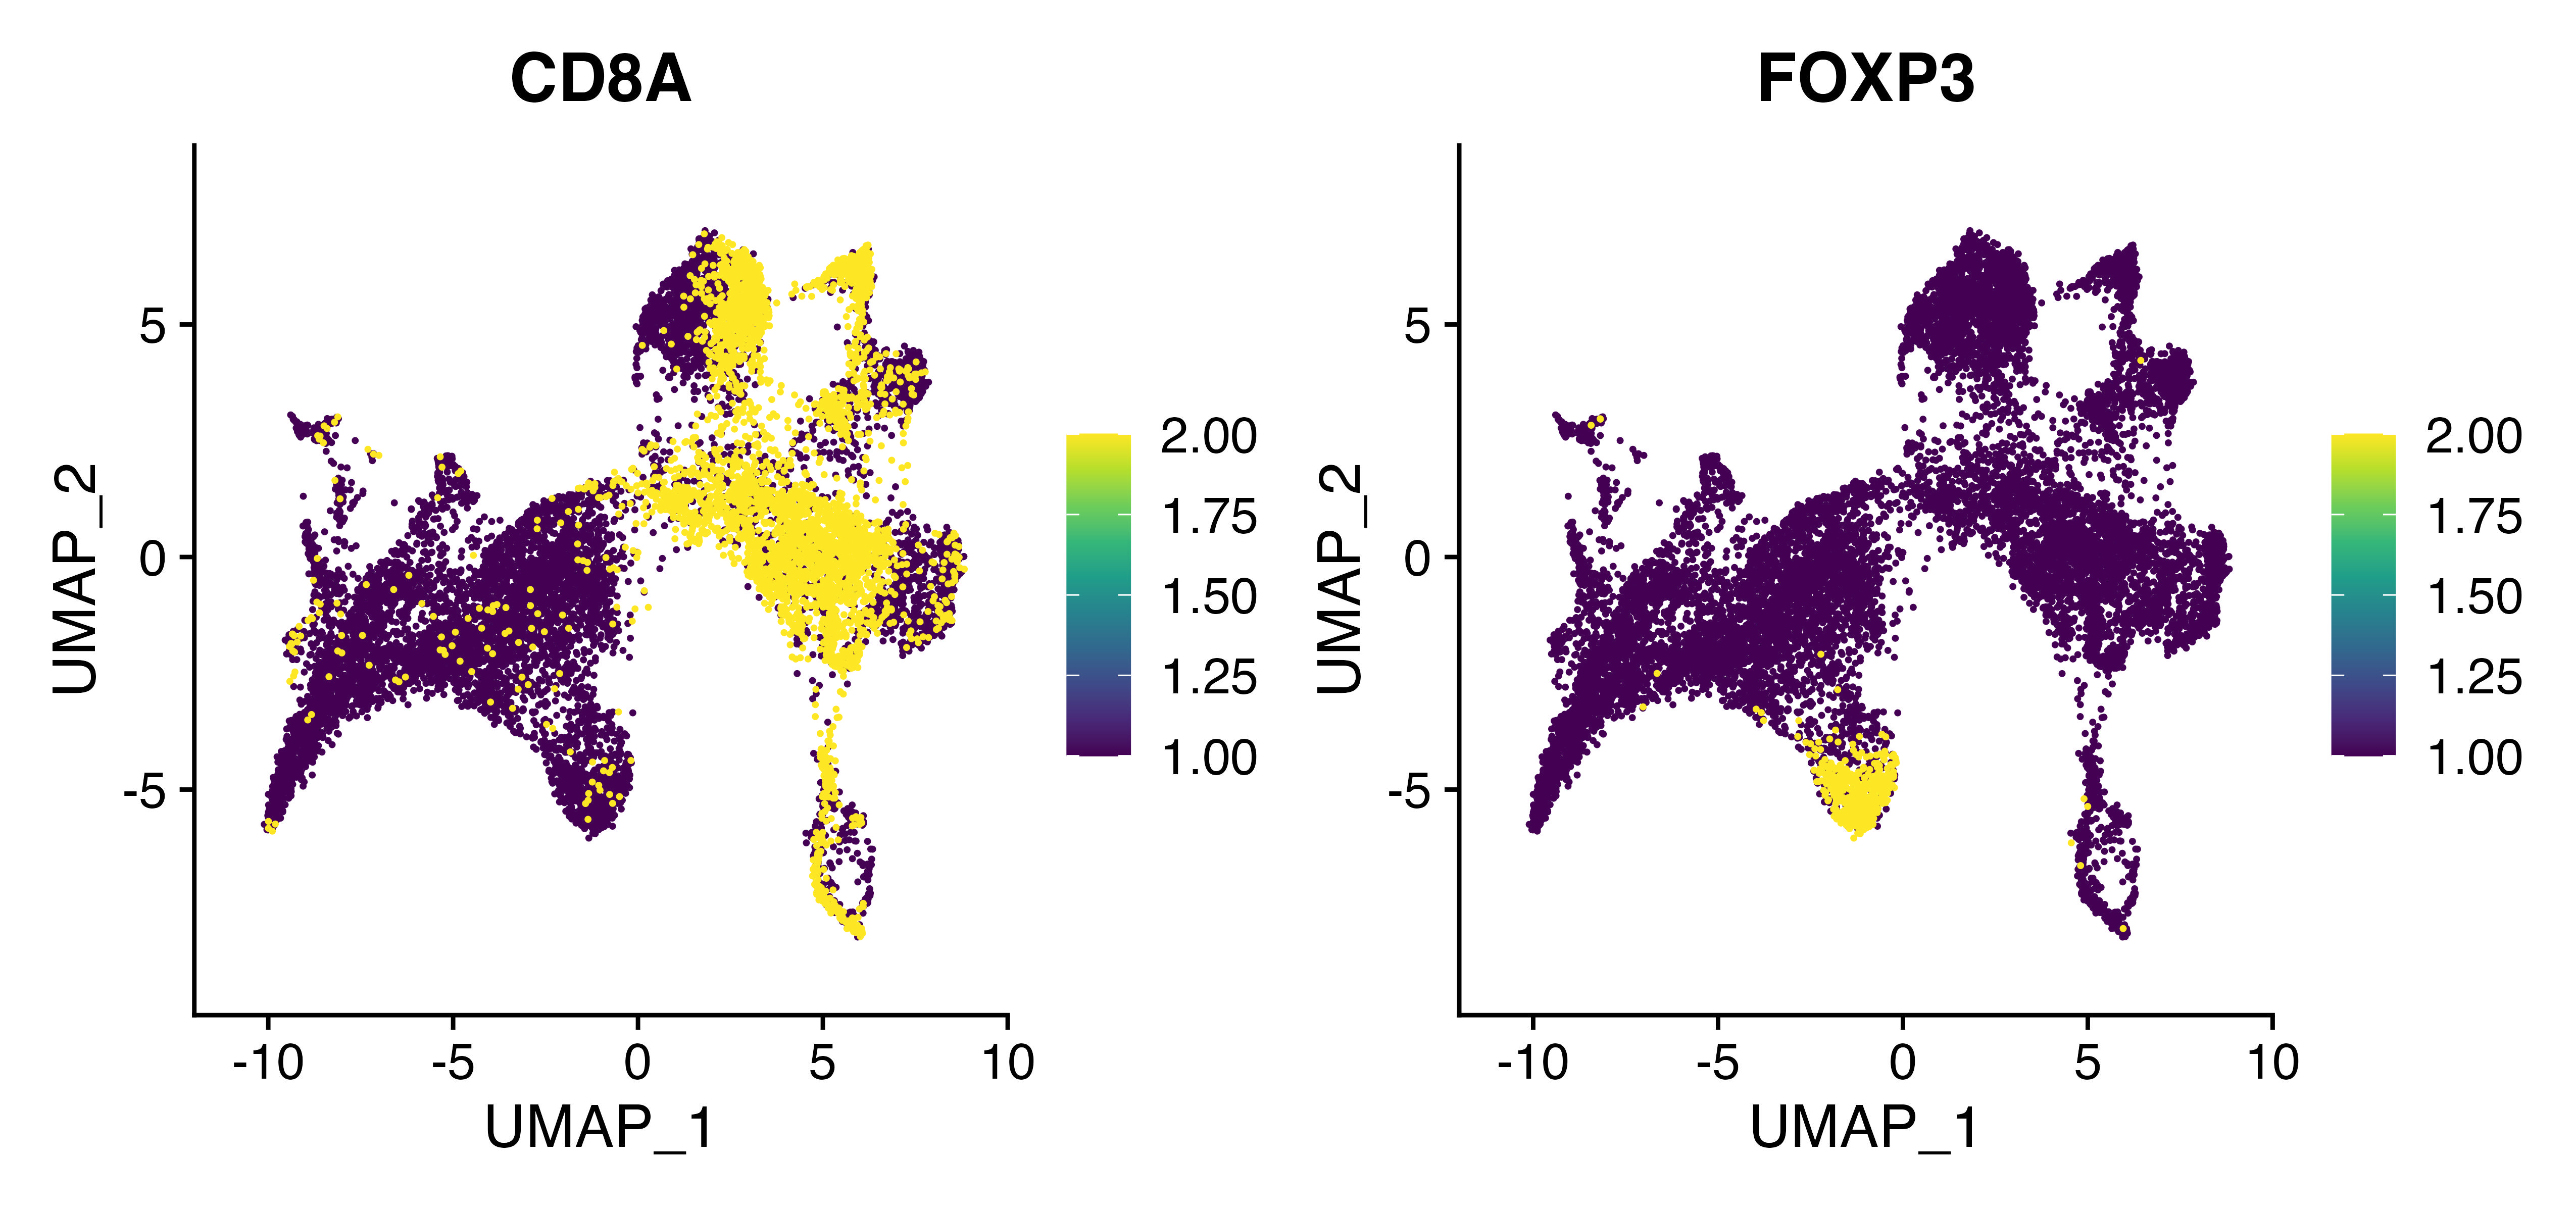
Comparing with Gene Expression
Here you can see the TCRalpha.CD8 model appears to preferentially identify CD8A-positive cells in the upper dense cluster.
FeaturePlot(seurat, c("CD8A", "FOXP3"), cols = viridis_pal()(10), order = TRUE)
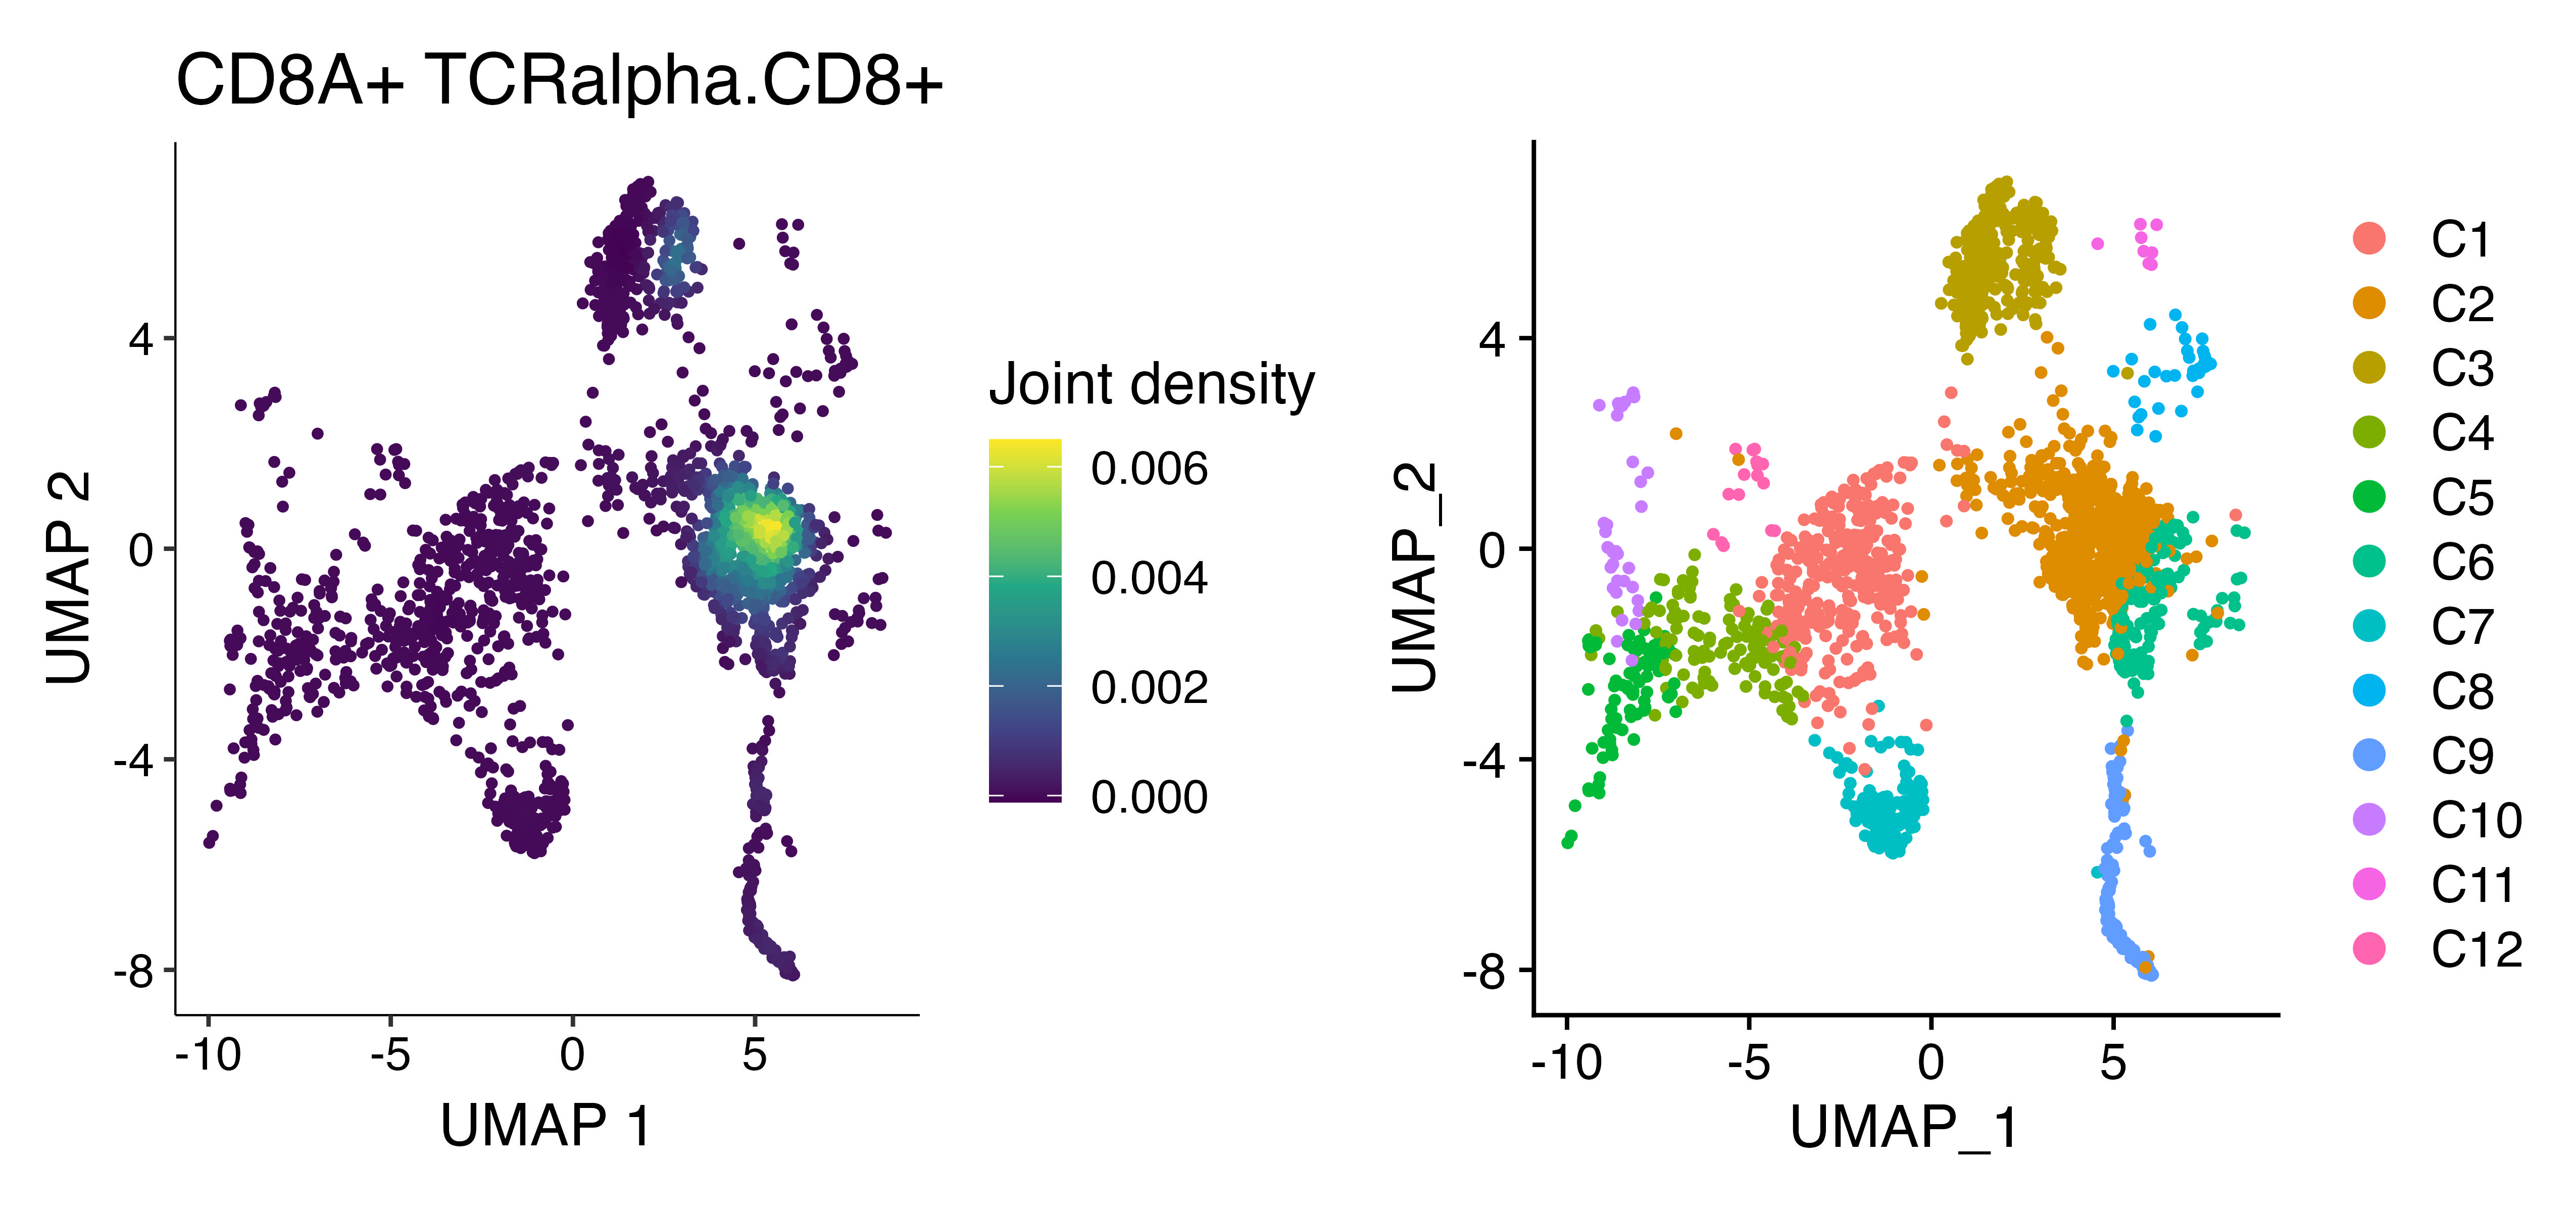
We can look at the overlay of both CD8A gene expression and the predicted CD8 score based on the alpha chain analysis using scCustomize function Plot_Density_Joint_Only(). What is really interesting to me is the CD8+ portion of C3 that tcrpheno identifies with the CD8 alpha model.
cells <- rownames(seurat[[]])[!is.na(seurat@meta.data$TCRalpha.CD8)]
seurat.subset <- subset(seurat, cells = cells)
plot1 <- Plot_Density_Joint_Only(seurat_object = seurat.subset, features = c("CD8A", "TCRalpha.CD8"), viridis_palette = "viridis")
plot2 <- DimPlot(seurat.subset)
plot1 + plot2
Nick Borcherding
Assistant Professor of Pathology & Immunology
My research integrates systems immunology, single-cell sequencing, and computational frameworks to understand the adaptive immune response.